People employed by type of country of birth by age group
2009-07-28
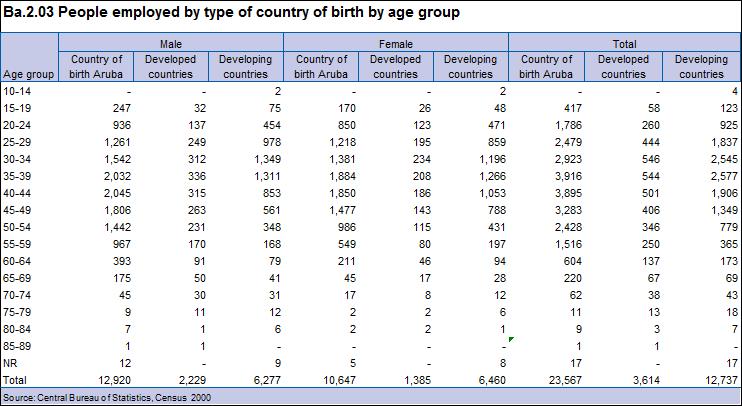
This table shows: People employed by type of country of birth by age group Ba.2.03 Download items: Ba.2.03 – – (21 kB)Continue Reading
This table shows: People employed by type of country of birth by age group Ba.2.03 Download items: Ba.2.03 – – (21 kB)Continue Reading
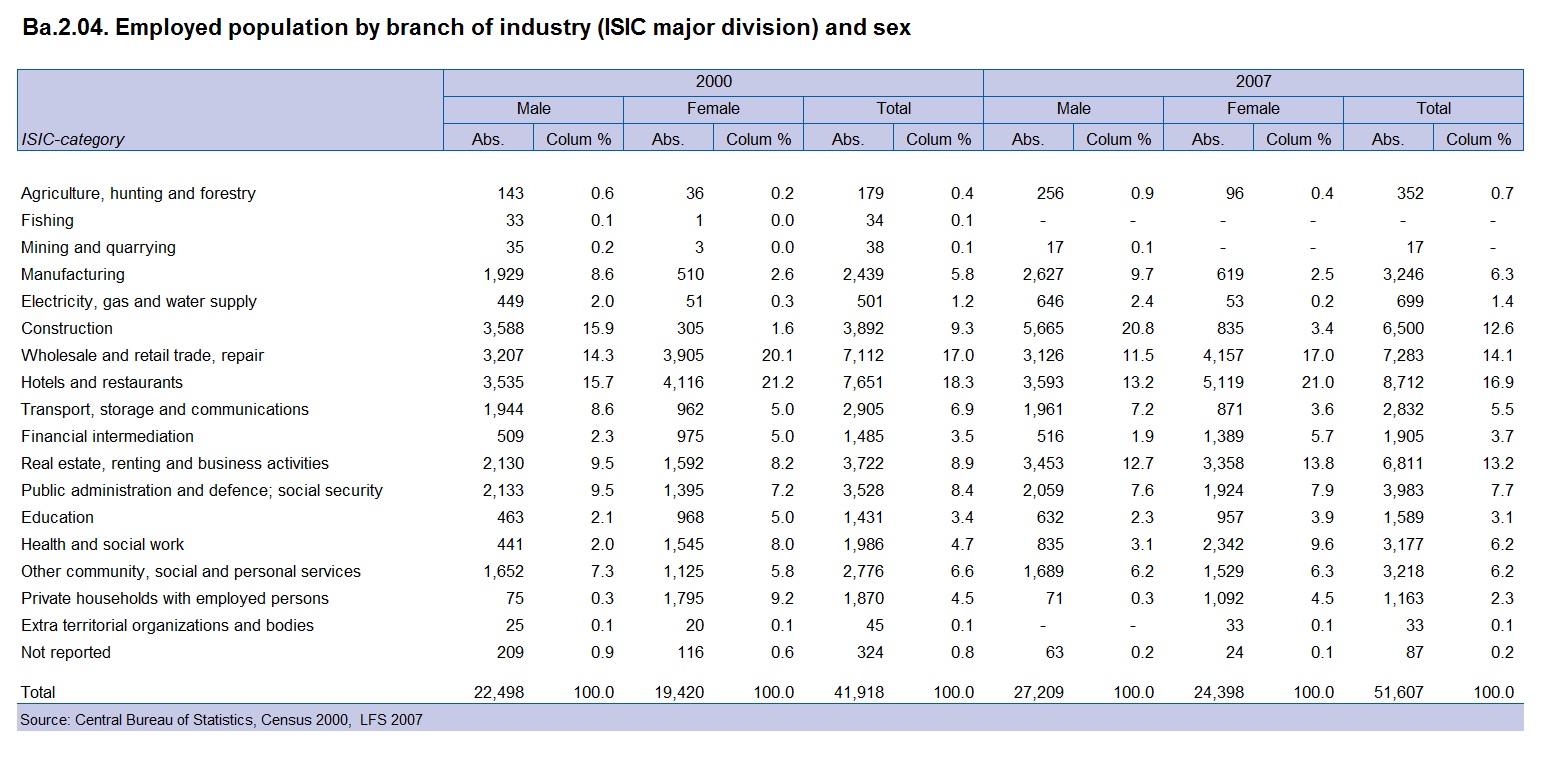
This table shows: Employed population by branch of industry (ISIC major division) and sex Ba.2.04 Download items: Ba.2.04 – – (28 kB)Continue Reading
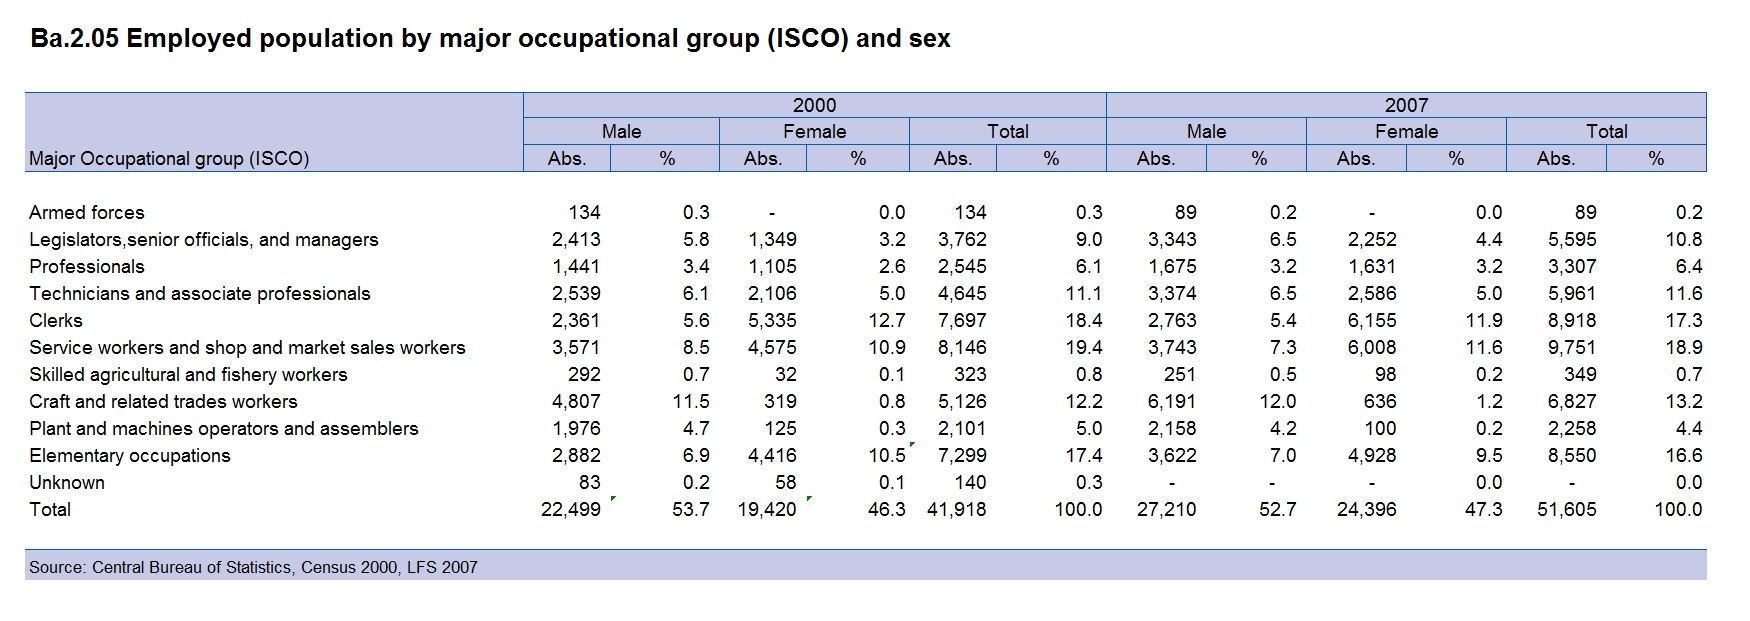
This table shows: Employed population by major occupational group (ISCO) and sex Ba.2.05 Download items: Ba.2.05 – – (35 kB)Continue Reading
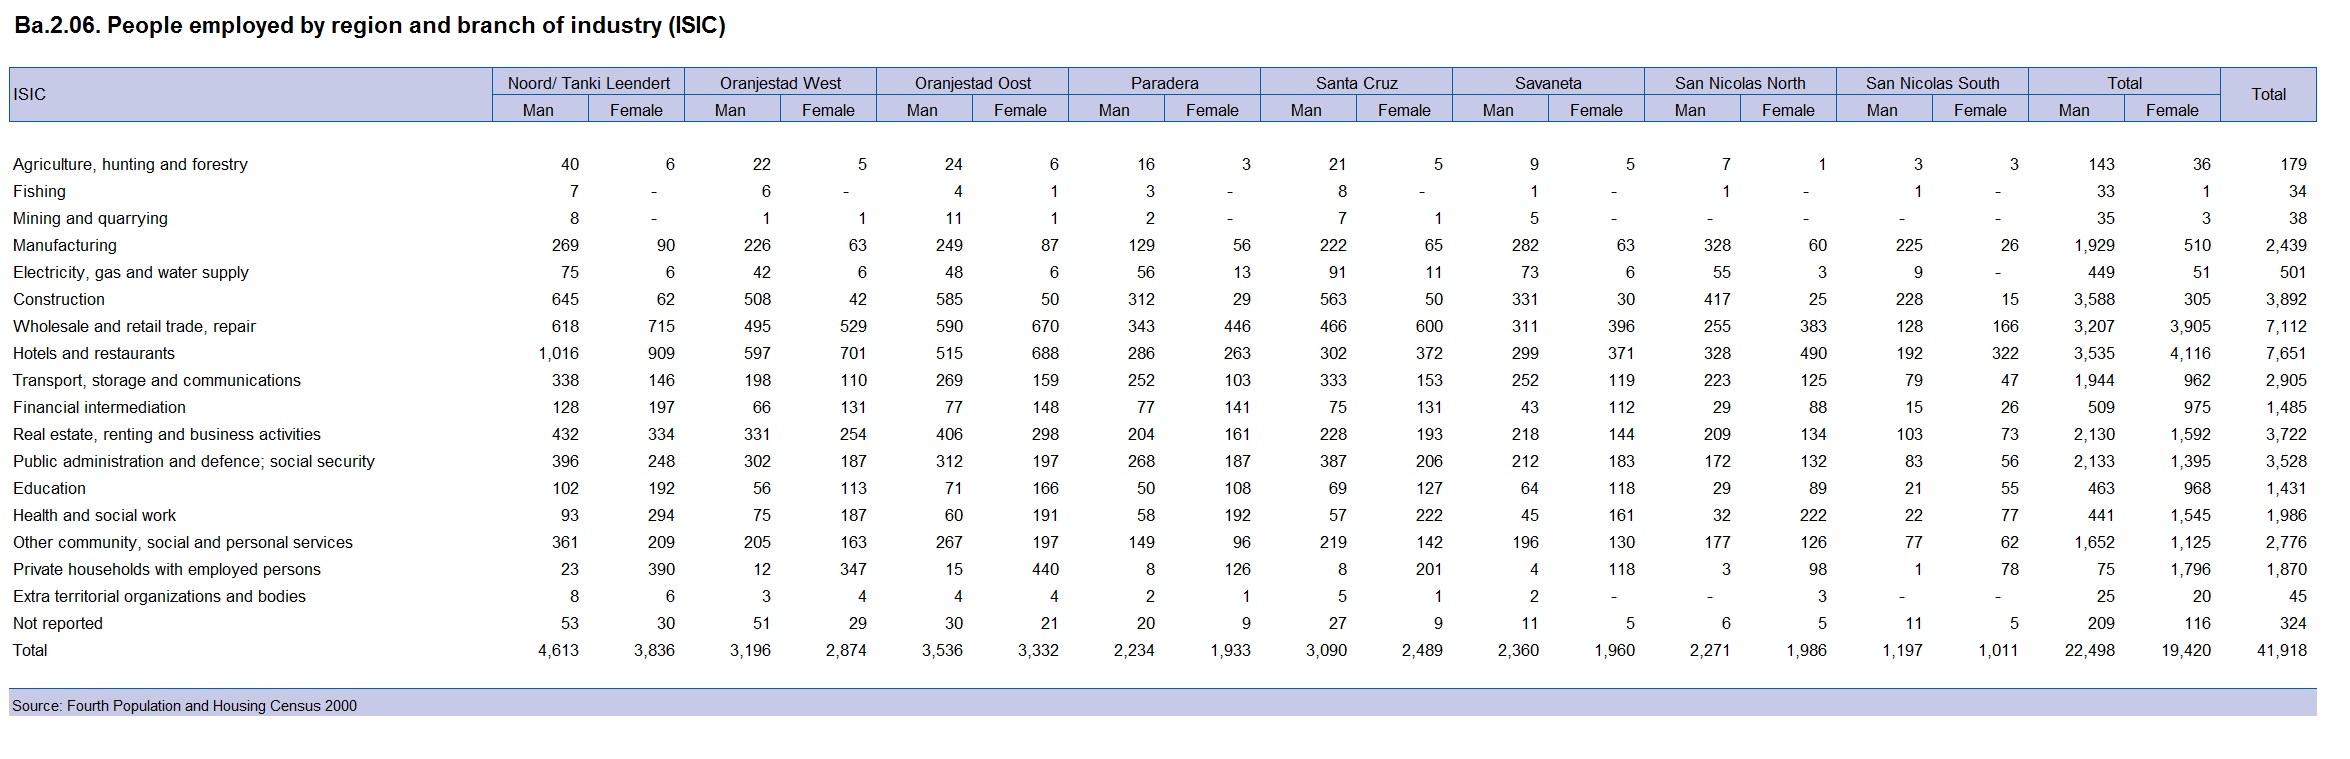
This table shows: People employed by region and branch of industry (ISIC) Ba.2.06 Download items: Ba.2.06 – – (30 kB)Continue Reading
This table shows: Filled jobs by status in employment, sex and institutional sector Ba.2.07 Download items: Ba.2.07 – – (29 kB)Continue Reading
This table shows: People by region of work, age category and sex Ba.2.08 Download items: Ba.2.08 – – (42 kB)Continue Reading
This table shows: Number of persons by place of work and mode of transport to work Ba.2.09 Download items: Ba.2.09 – – (30 kB)Continue Reading
This table shows: Employed population by industry (ISIC), local and foreign born and gender Ba.2.10 Download items: Ba.2.10 – – (28 kB)Continue Reading
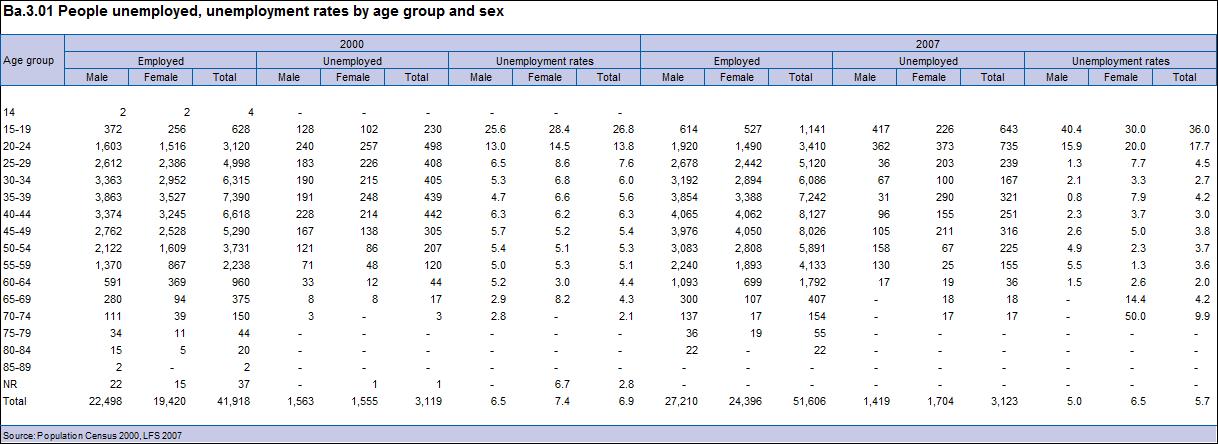
This table shows: People unemployed, unemployment rates by age group and sex Ba.3.01 Download items: Ba.3.01 – – (42 kB)Continue Reading
This table shows: People unemployed and unemployment rates by country of birth and sex Ba.3.02 Download items: Ba.3.02 – – (38 kB)Continue Reading
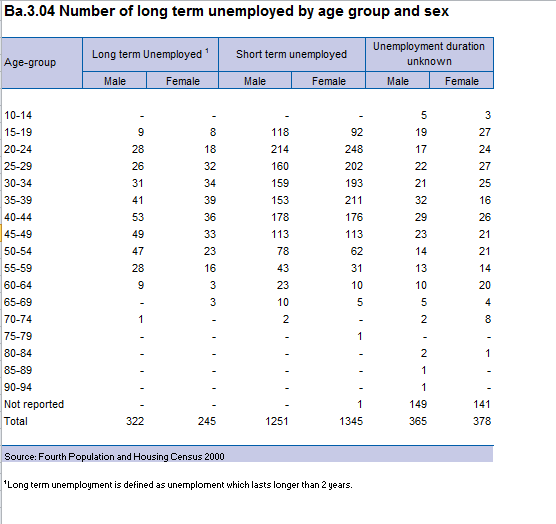
This table shows the number of long-term unemployed by age group and sex Ba.3.04 Download items: Ba.3.04 – – (20 kB)Continue Reading
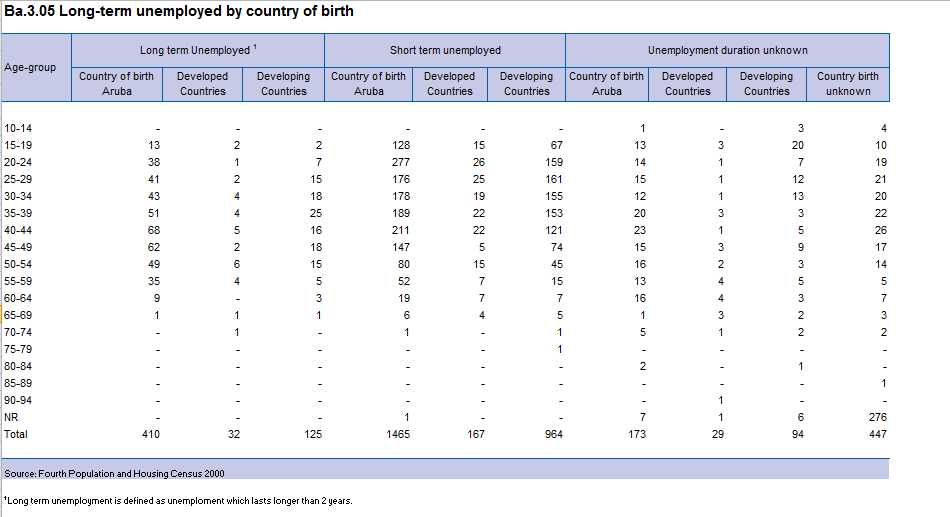
This table shows the long-term unemployment by country of birth Ba.3.05 Download items: Ba.3.05 – – (21 kB)Continue Reading
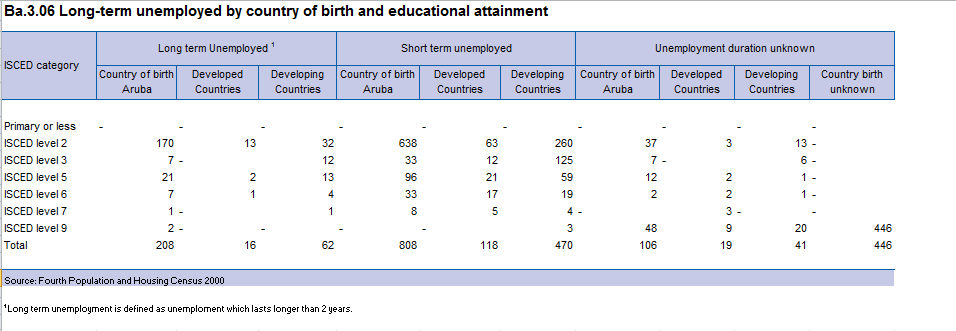
This table shows the long-term unemployment by country of birth and educational attainment Ba.3.06 Download items: Ba.3.06 – – (26 kB)Continue Reading
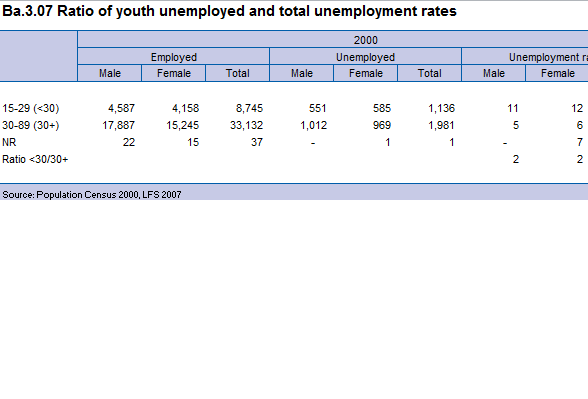
This table shows the ratio of youth unemployed and total unemployment rates Ba.3.07 Download items: Ba.3.07 – – (40 kB)Continue Reading
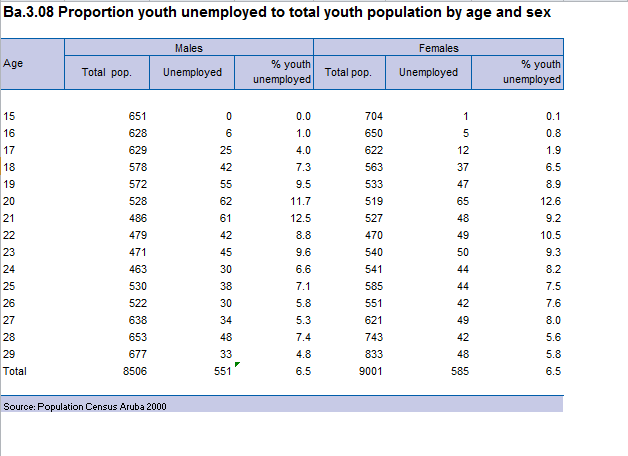
This table shows the proportion of youth unemployment to total youth population by age and sex Ba.3.08 Download items: Ba.3.08 – – (20 kB)Continue Reading
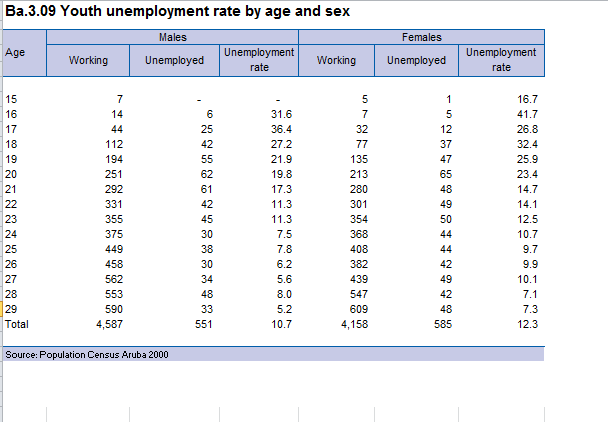
This table shows the youth unemployment rate by age and sex Ba.3.09 Download items: Ba.3.09 – – (20 kB)Continue Reading
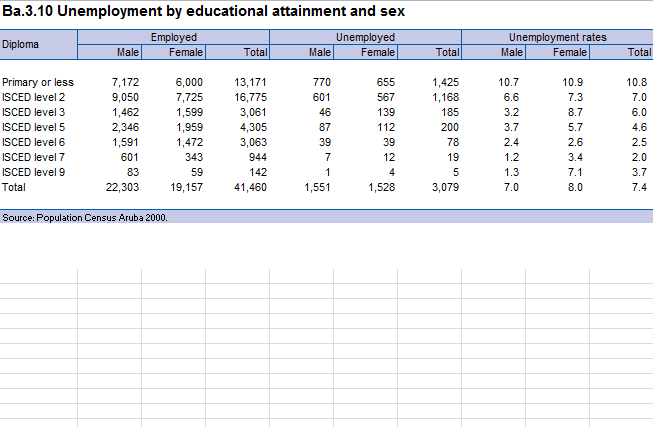
This table shows the unemployment by educational attainment and sex Ba.3.10 Download items: Ba.3.10 – – (25 kB)Continue Reading
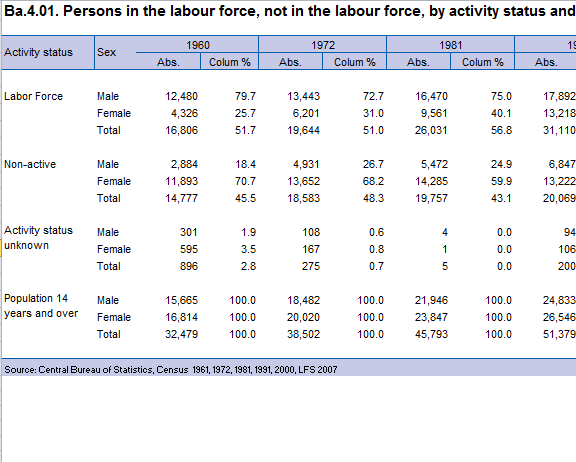
This tables shows the persons in the labor force, not in the labor force, by activity status and sex Ba.4.01 Download items: Ba.4.01 – – (20 kB)Continue Reading
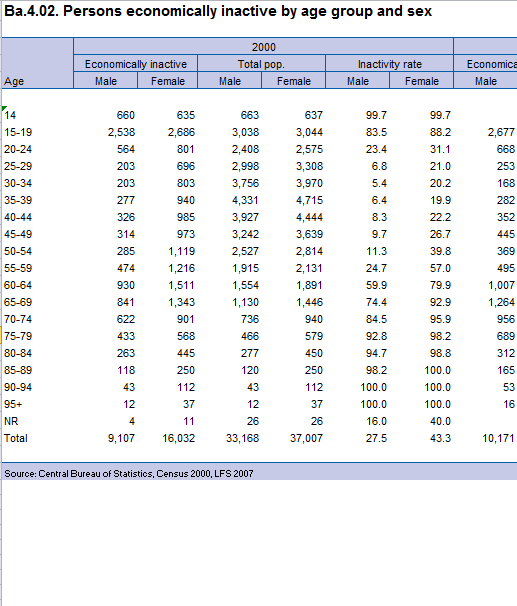
This table shows the persons economically inactive by age group and sex Ba.4.02 Download items: Ba.4.02 – – (29 kB)Continue Reading