People not in the labor force by main activity, age and sex
2009-07-28
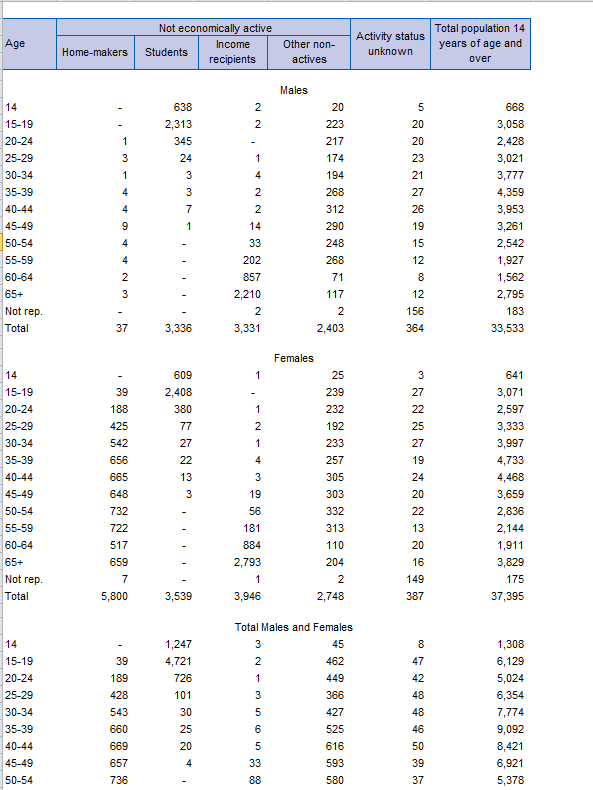
This table shows the people that are not in the labor force by main activity, age and sex Ba.4.03 Download items: Ba.4.03 – – (27 kB)Continue Reading
This table shows the people that are not in the labor force by main activity, age and sex Ba.4.03 Download items: Ba.4.03 – – (27 kB)Continue Reading
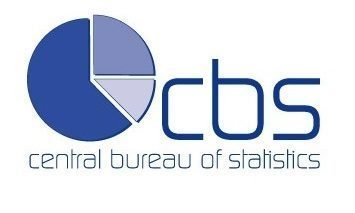
This table shows the highest educational qualification by status of employment by age and sex Ba.5.01 Download items: Ba.5.01 – – (39 kB)Continue Reading
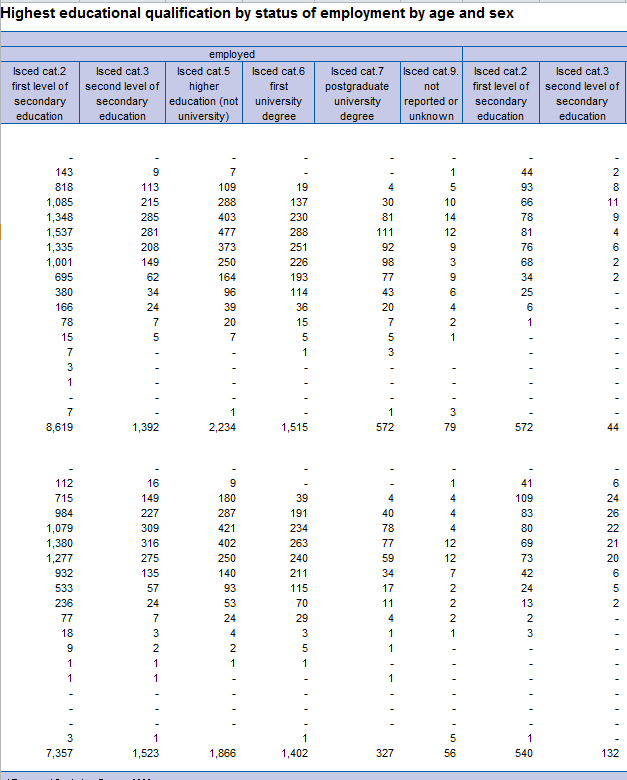
This table shows the highest educational qualification of employed population by occupation and sex Ba.5.02 Download items: Ba.5.02 – – (26 kB)Continue Reading
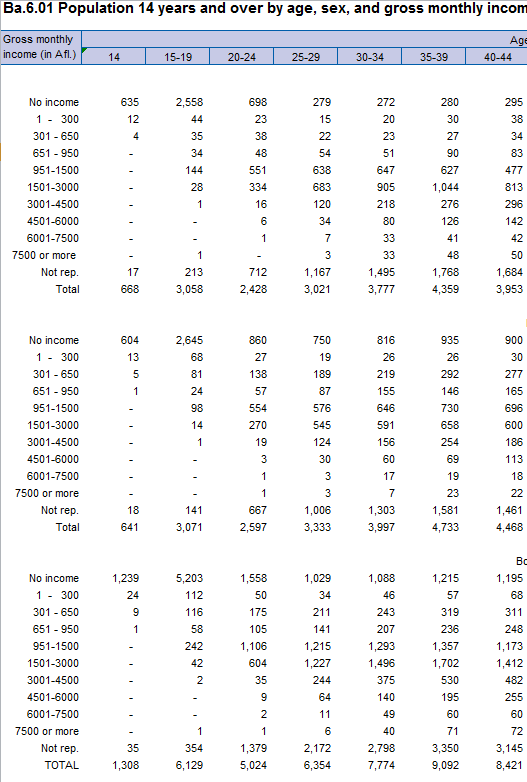
This table shows the population of 14 years and over by age, sex and gross monthly income Ba.6.01 Download items: Ba.6.01 – – (32 kB)Continue Reading
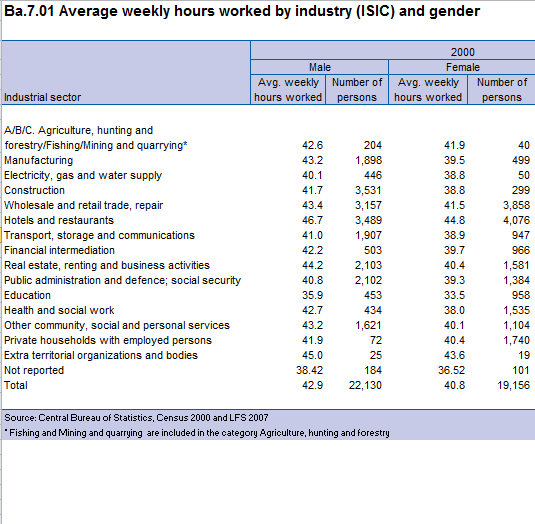
This table shows the average weekly hours worked by industry (according to ISIC) and gender Ba.7.01 Download items: Ba.7.01 – – (34 kB)Continue Reading
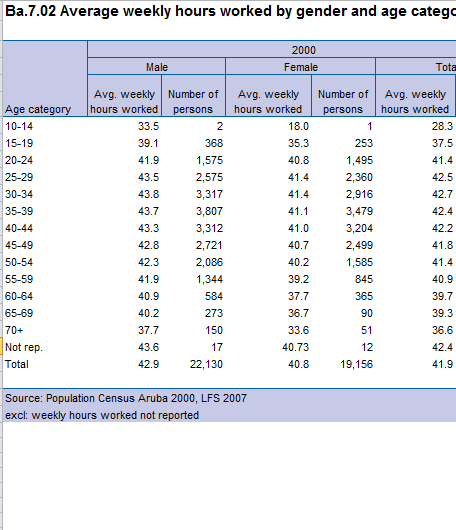
This table shows the average of weekly hours worked by gender and age category Ba.7.02 Download items: Ba.7.02 – – (36 kB)Continue Reading
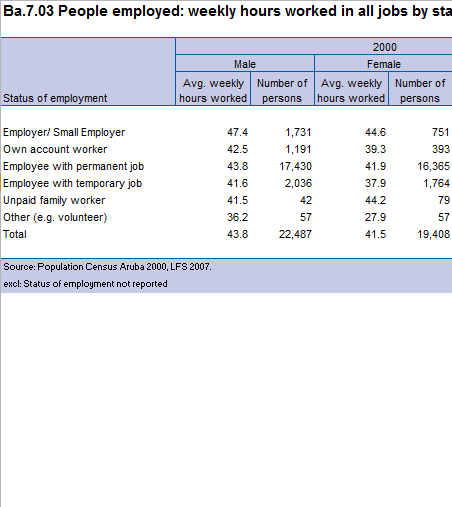
In this table you will find information about people employed based on weekly hours working in all jobs by their status Ba.7.03 Download items: Ba.7.03 – – (32 kB)Continue Reading
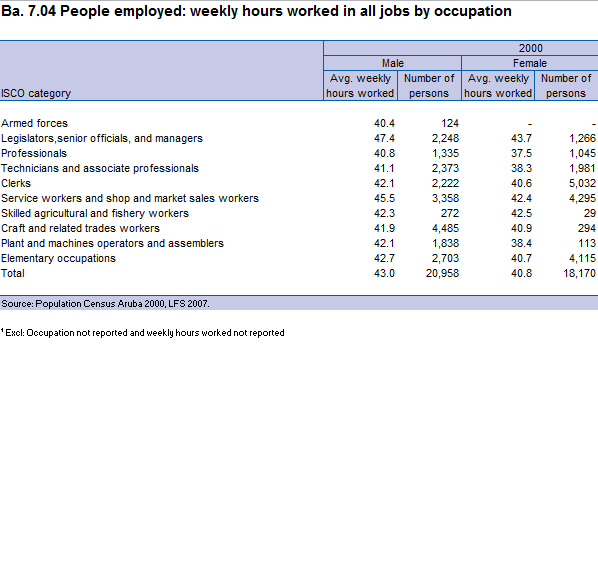
In this table you can find information about the people employed on basis of weekly hours working in all jobs Ba.7.04 Download items: Ba.7.04 – – (36 kB)Continue Reading
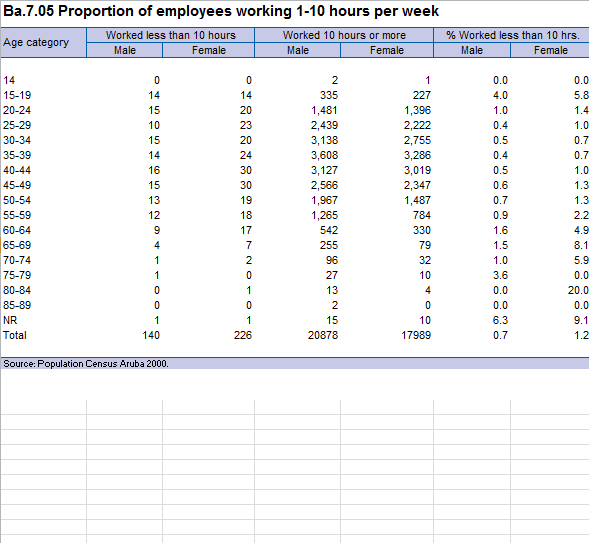
In this table you can find information about the proportion of employees working 1 – 10 hours per week Ba.7.05 Download items: Ba.7.05 – – (27 kB)Continue Reading
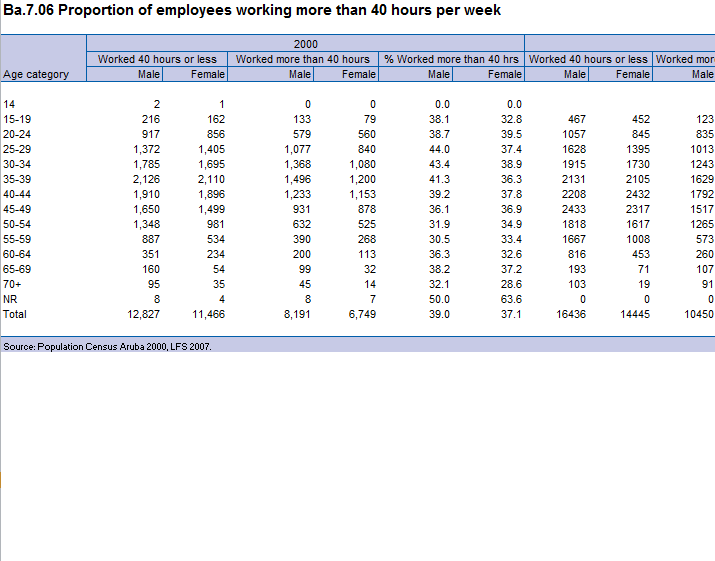
In this table you can find information about the proportion of employees working more than 40 hours per week Ba.7.06 Download items: Ba.7.06 – – (37 kB)Continue Reading

Developments of Aruba’s Labor Force 2007 Download items: Developments_of_Aruba_s_Labor_Force_2007_Original – – (4 MB)Continue Reading
Income & Expenditure Survey 2006 Download items: Income and Expenditure Survey 2006 – – (3 MB)Continue Reading
Labor Force Projections, 2003-2023 Download items: 04-06-B Labor Force Projections – – (126 kB)Continue Reading
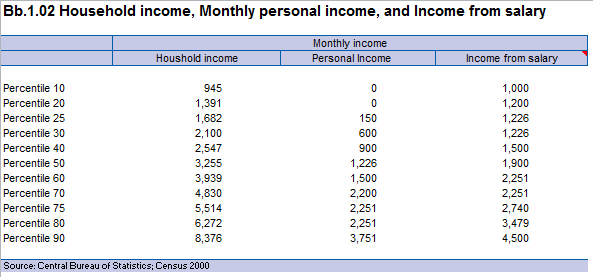
Household income, Monthly personal income, and Income from salary Download items: Bb.1.02 – – (29 kB)Continue Reading
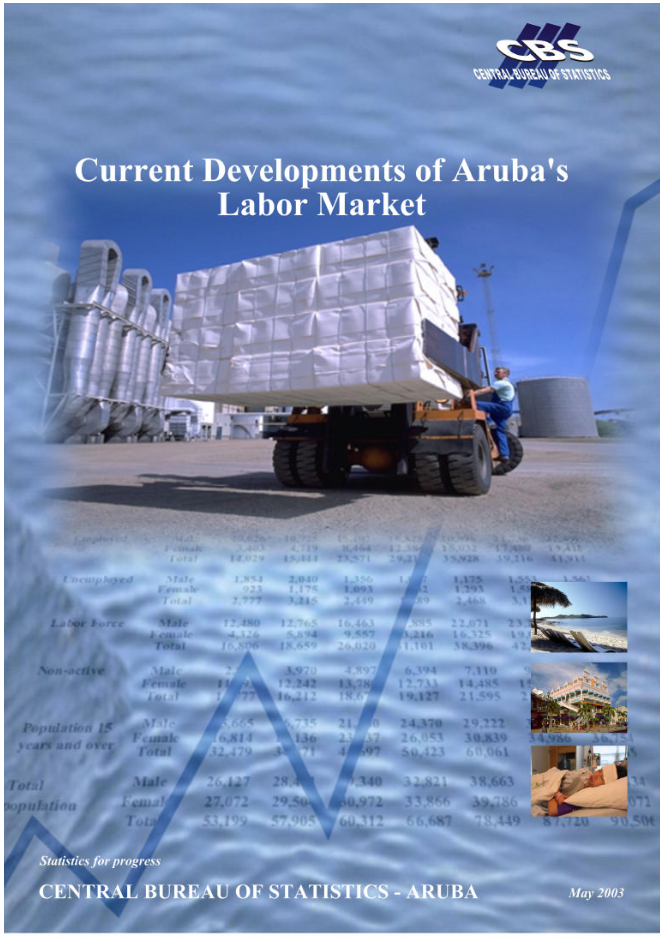
Current Developments of Aruba’s labor market 2003 Download items: CURRENT_DEVELOPMENTS_OF_ARUBA’S_LABOR_MARKET – – (2 MB)Continue Reading
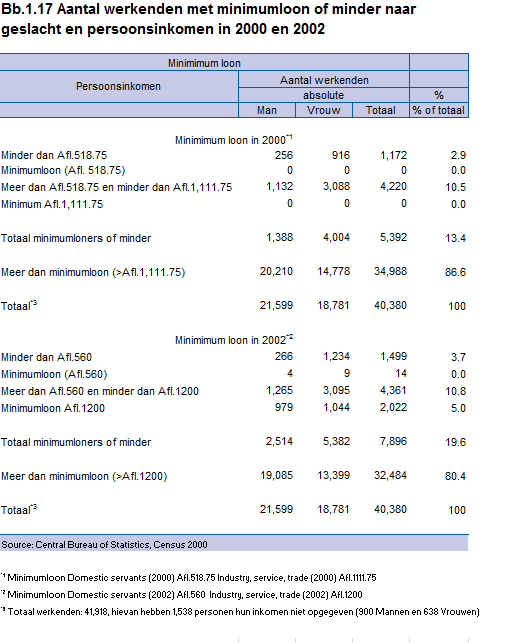
Aantal werkenden met minimumloon of minder naar geslacht en persoonsinkomen in 2000 en 2002 Download items: Bb.1.17 – – (22 kB)Continue Reading
Lorenz-curve for households based on the Census 2000 Download items: Bb.1.01 – – (41 kB)Continue Reading
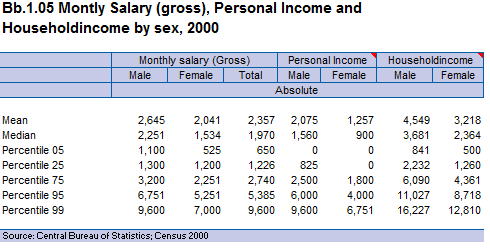
Monthly Salary (gross), Personal Income and Household income by sex, 2000 Download items: Bb.1.05 – – (24 kB)Continue Reading
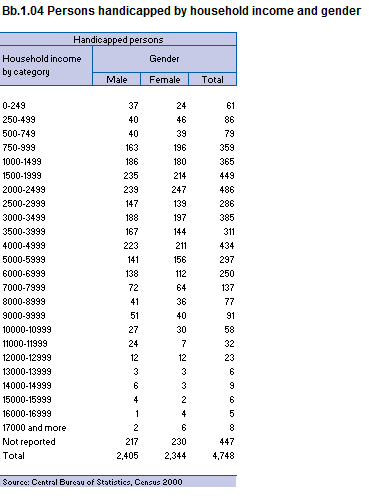
Persons handicapped by household income and gender Download items: Bb.1.04 – – (22 kB)Continue Reading
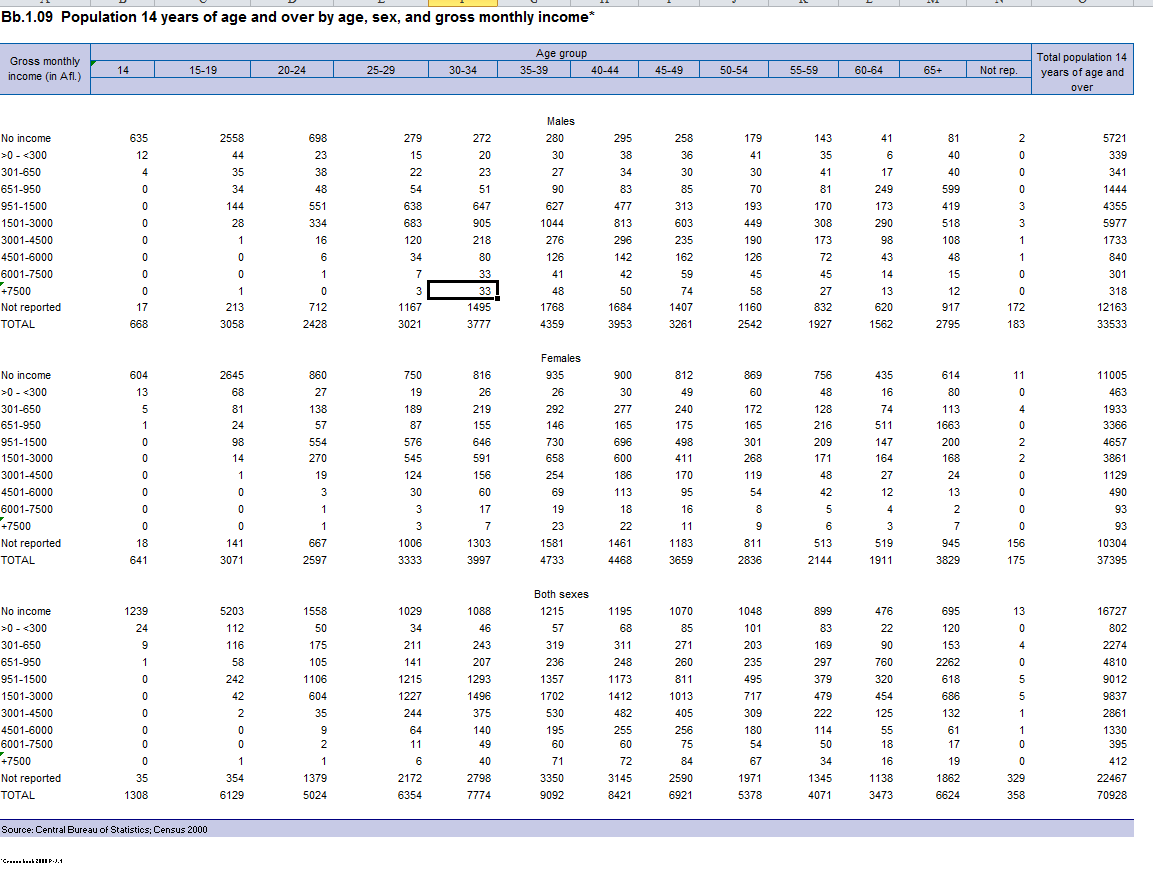
Population 14 years of age and over by age, sex, and gross monthly income Download items: Bb.1.09 – – (40 kB)Continue Reading