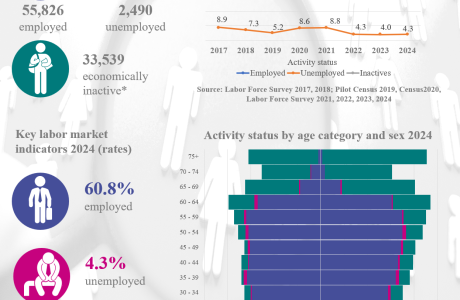
Labor Force Survey 2024
2025-06-06
*Data updated 19-06-2025 Download items: LFS2024Results – – (245 kB)Continue Reading
*Data updated 19-06-2025 Download items: LFS2024Results – – (245 kB)Continue Reading
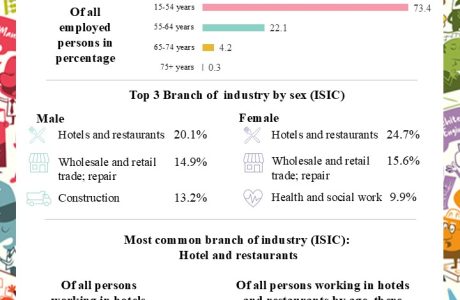
In connection with the celebration of Labor Day, the CBS presents the infographic “Branch of Industry and Occupation”. Download items: ISCOISIC2023 – – (324 kB)Continue Reading
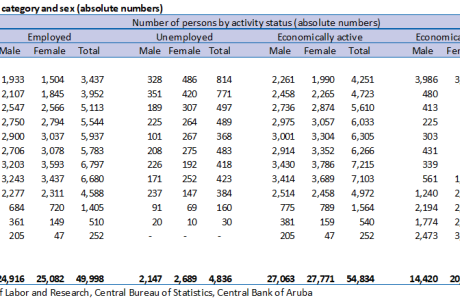
This table shows: Results Labor Force Survey 2021 by age category and sex (absolute numbers) Results Labor Force Survey 2021 by age category and sex (rates) Download items: Results Labor Force Survey 2021 – – (20 kB)Continue Reading
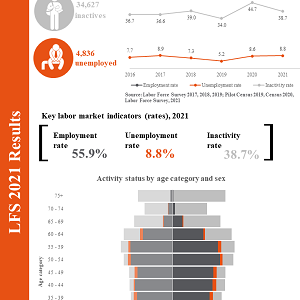

A majority of the population aged 15 to 74 years on the Dutch Caribbean islands are in paid work. The labour participation rate is highest on Bonaire (70 percent) and lowest on Curaçao (53 percent). The group 25 to 54-year-olds has the highest share of working people. Labour participation isContinue Reading
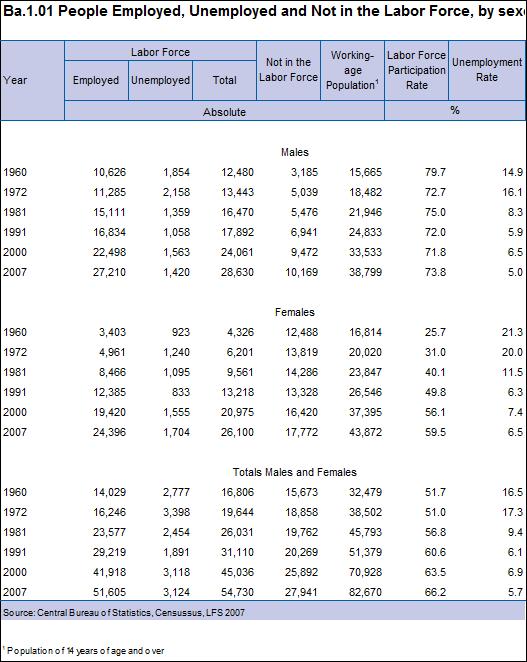
This table shows: People Employed, Unemployed and not in the Labor Force, by sex Ba.1.01 Download items: Ba.1.01 – – (47 kB)Continue Reading
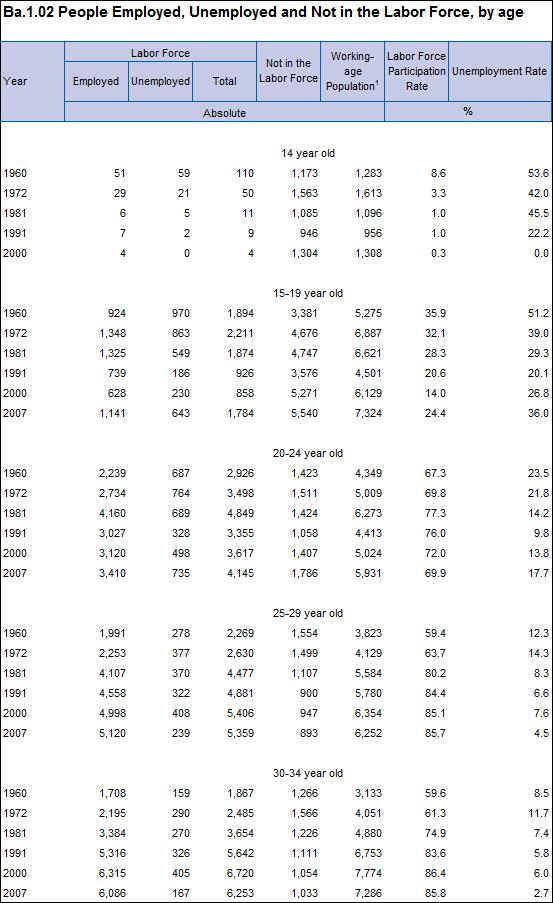
This table shows: People Employed, Unemployed and not in the Labor Force, by age group Ba.1.02 Download items: Ba.1.02 – – (40 kB)Continue Reading
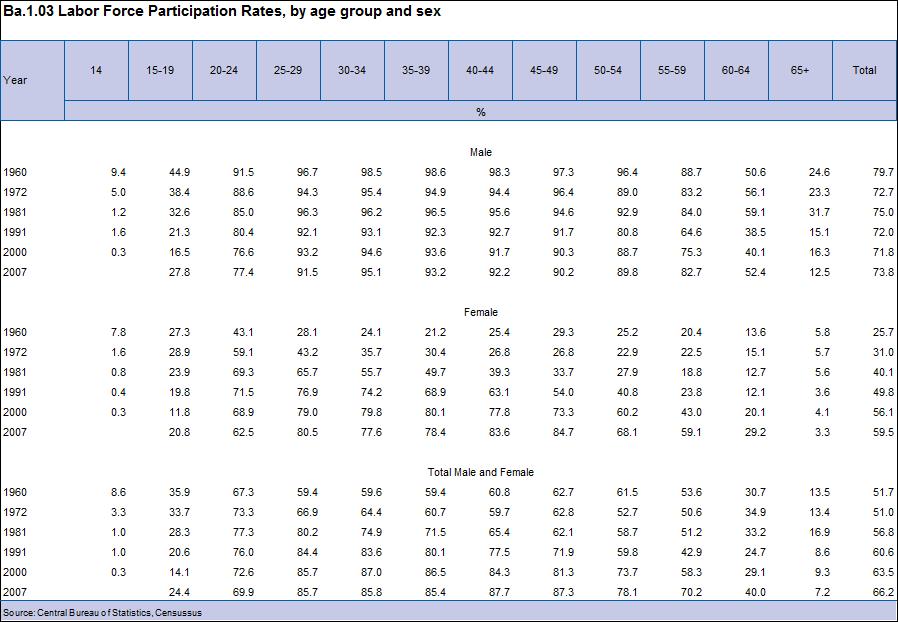
This table shows: Labor Force Participation Rates, by age group and sex Ba.1.03 Download items: Ba.1.03 – – (47 kB)Continue Reading
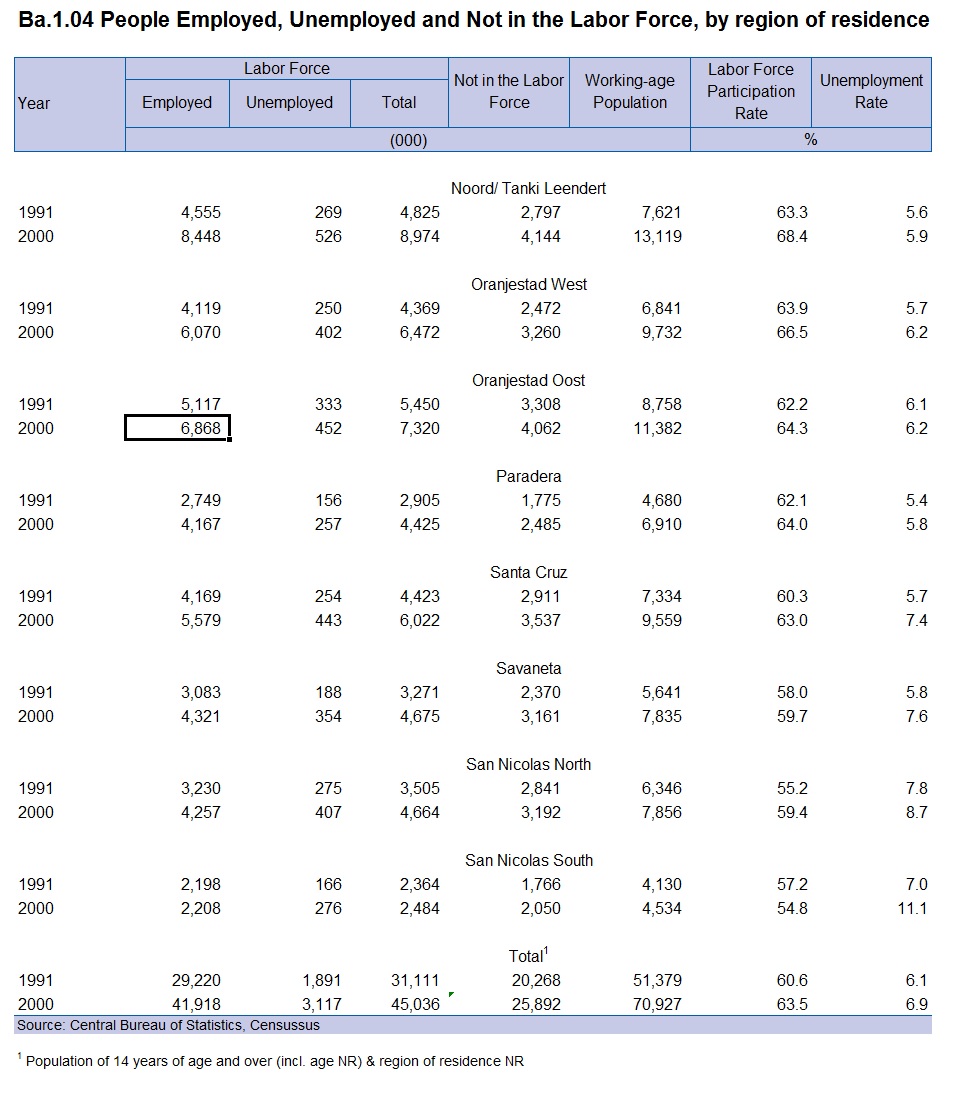
This table shows: People Employed, Unemployed and not in the Labor Force, by region of residence Ba.1.04 Download items: Ba.1.04 – – (33 kB)Continue Reading
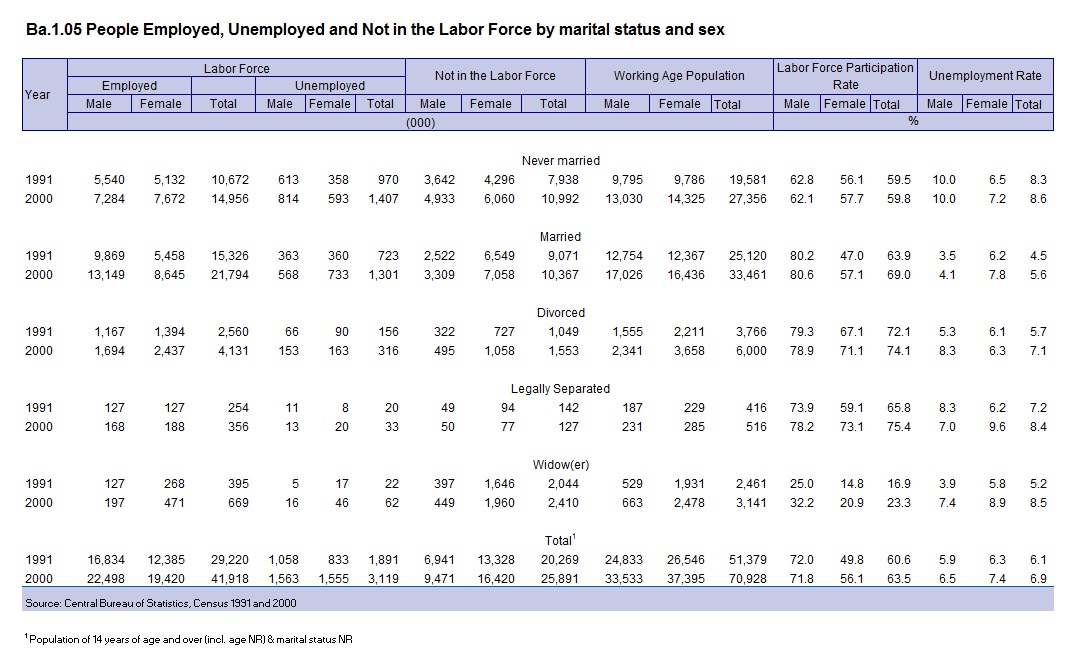
This table shows: People Employed, Unemployed and not in the Labor Force by marital status and sex Ba.1.05 Download items: Ba.1.05 – – (38 kB)Continue Reading
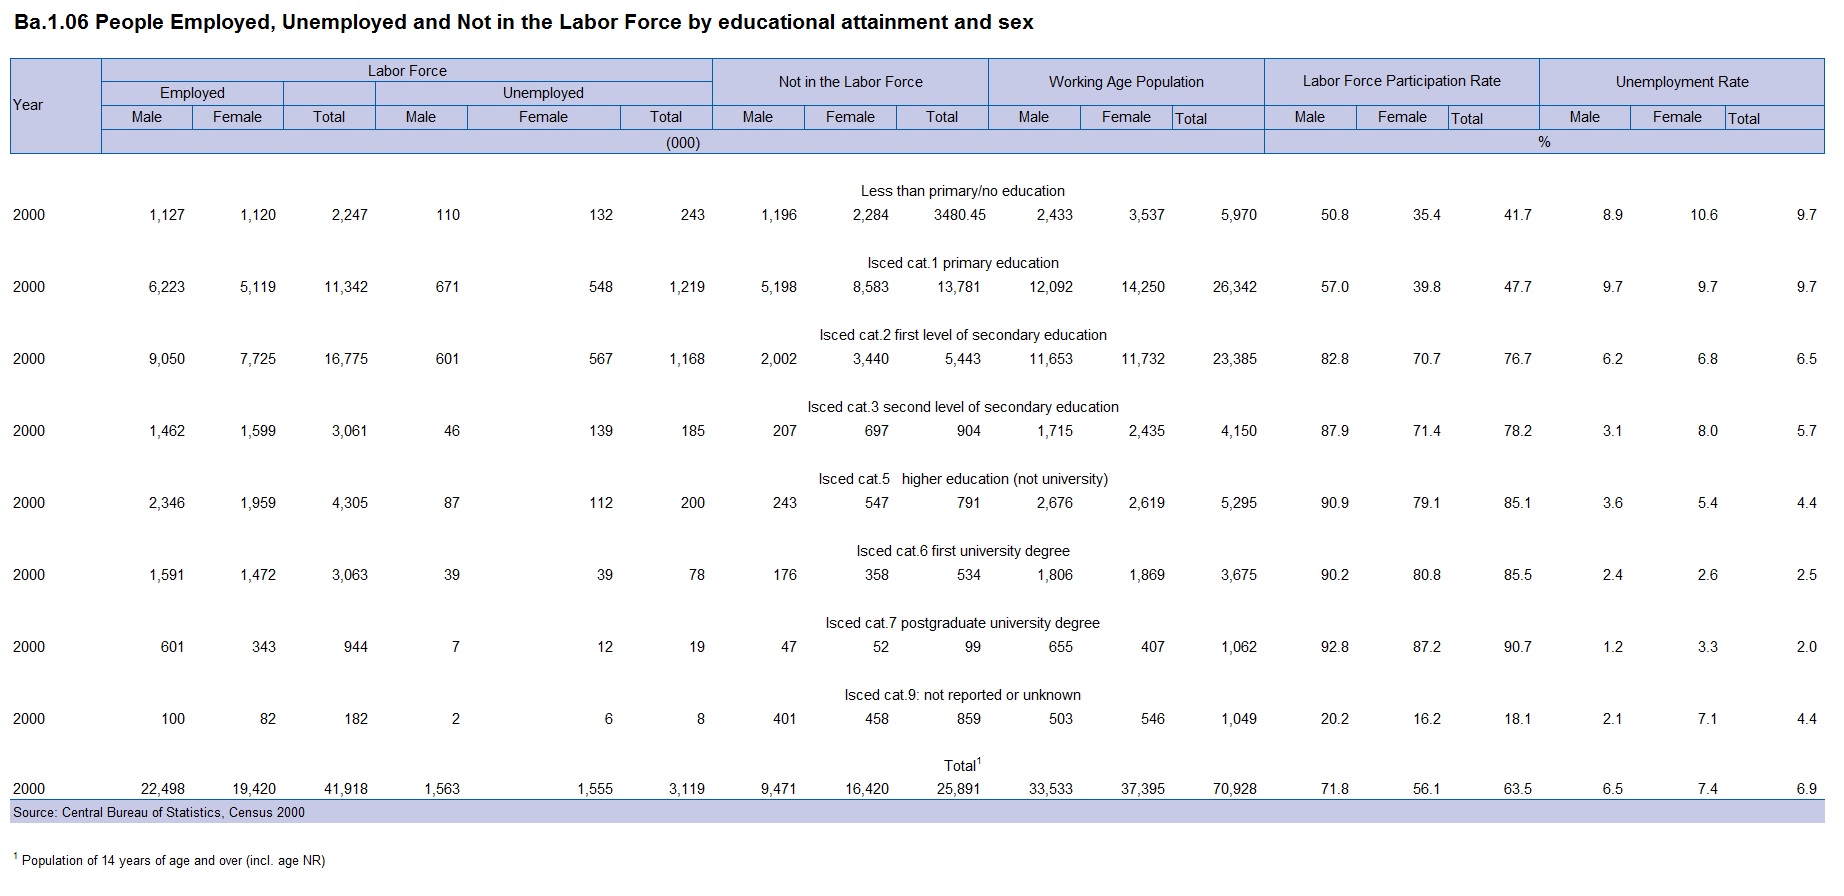
This table shows: People Employed, Unemployed and Not in the Labor Force by educational attainment and sex Ba.1.06 Download items: Ba.1.06 – – (40 kB)Continue Reading
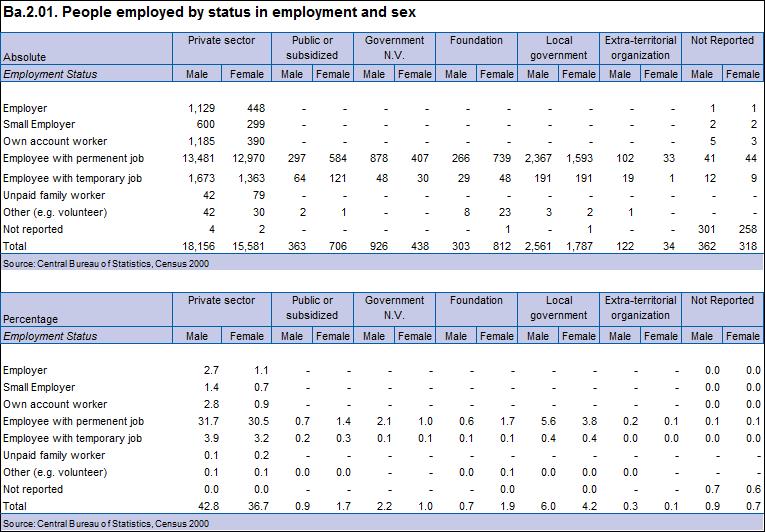
This table shows: People employed by status in employment and sex Ba.2.01 Download items: Ba.2.01 – – (26 kB)Continue Reading
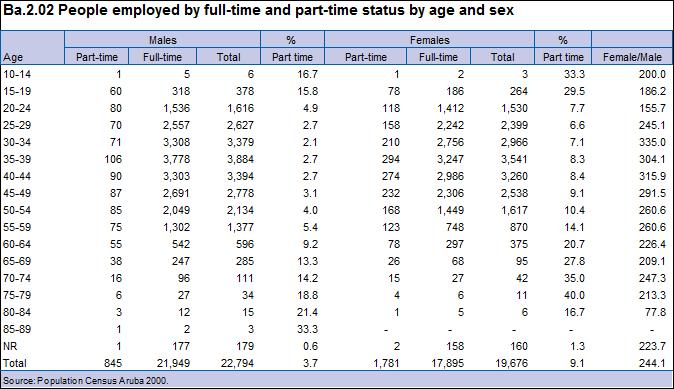
This table shows: People employed by full-time and part-time status by age and sex Ba.2.02 Download items: Ba.2.02 – – (23 kB)Continue Reading
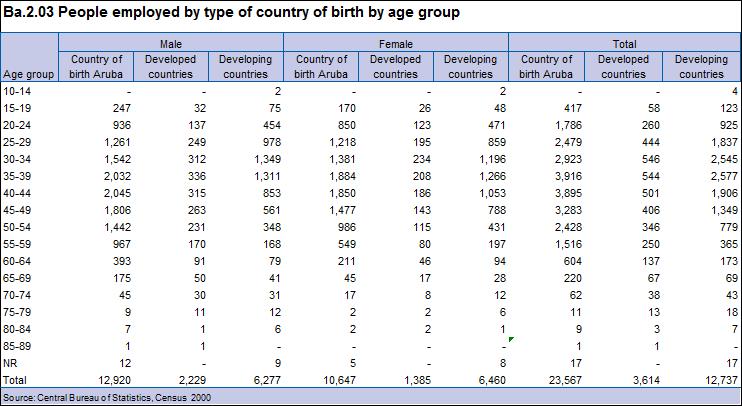
This table shows: People employed by type of country of birth by age group Ba.2.03 Download items: Ba.2.03 – – (21 kB)Continue Reading
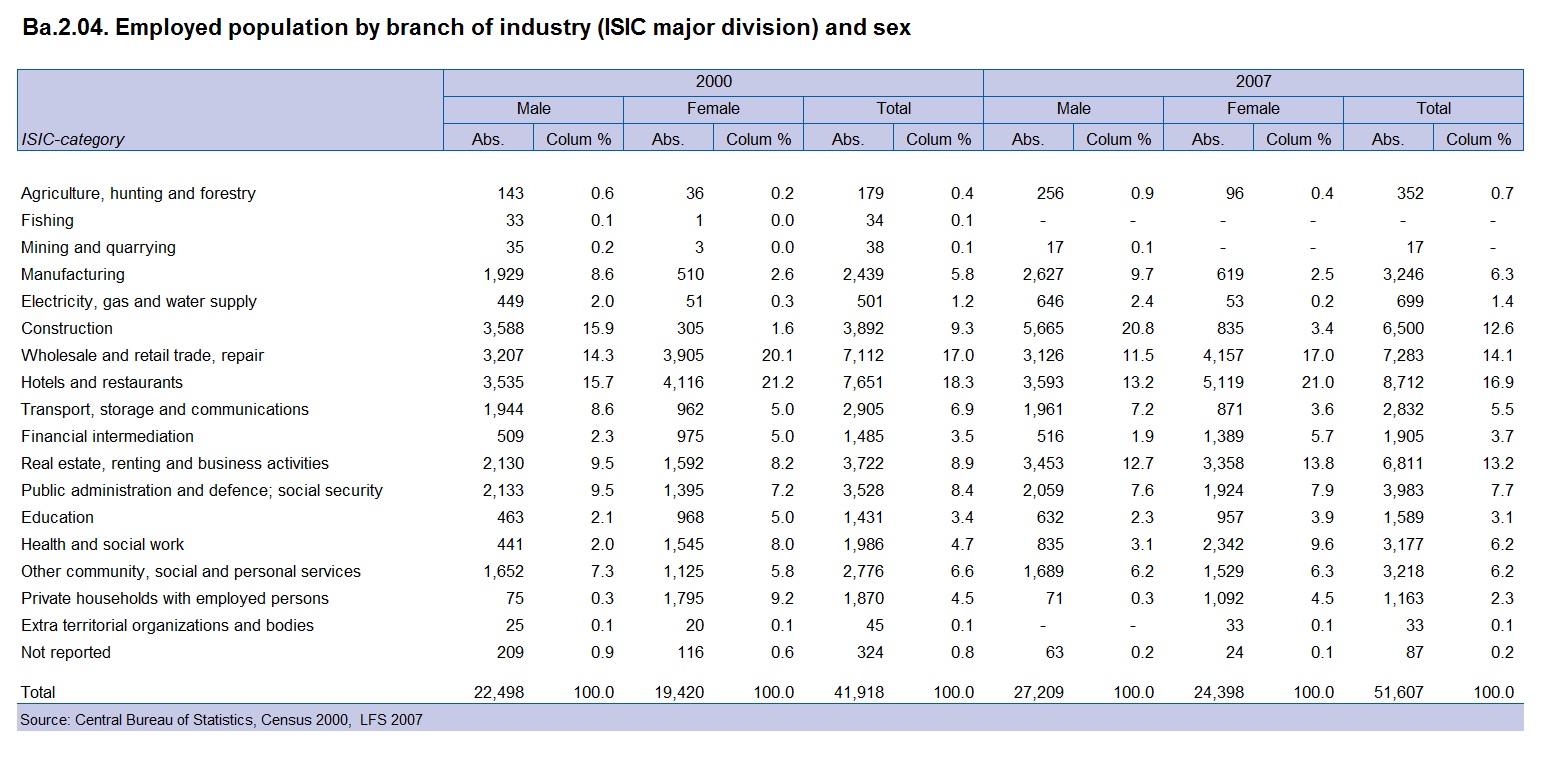
This table shows: Employed population by branch of industry (ISIC major division) and sex Ba.2.04 Download items: Ba.2.04 – – (28 kB)Continue Reading
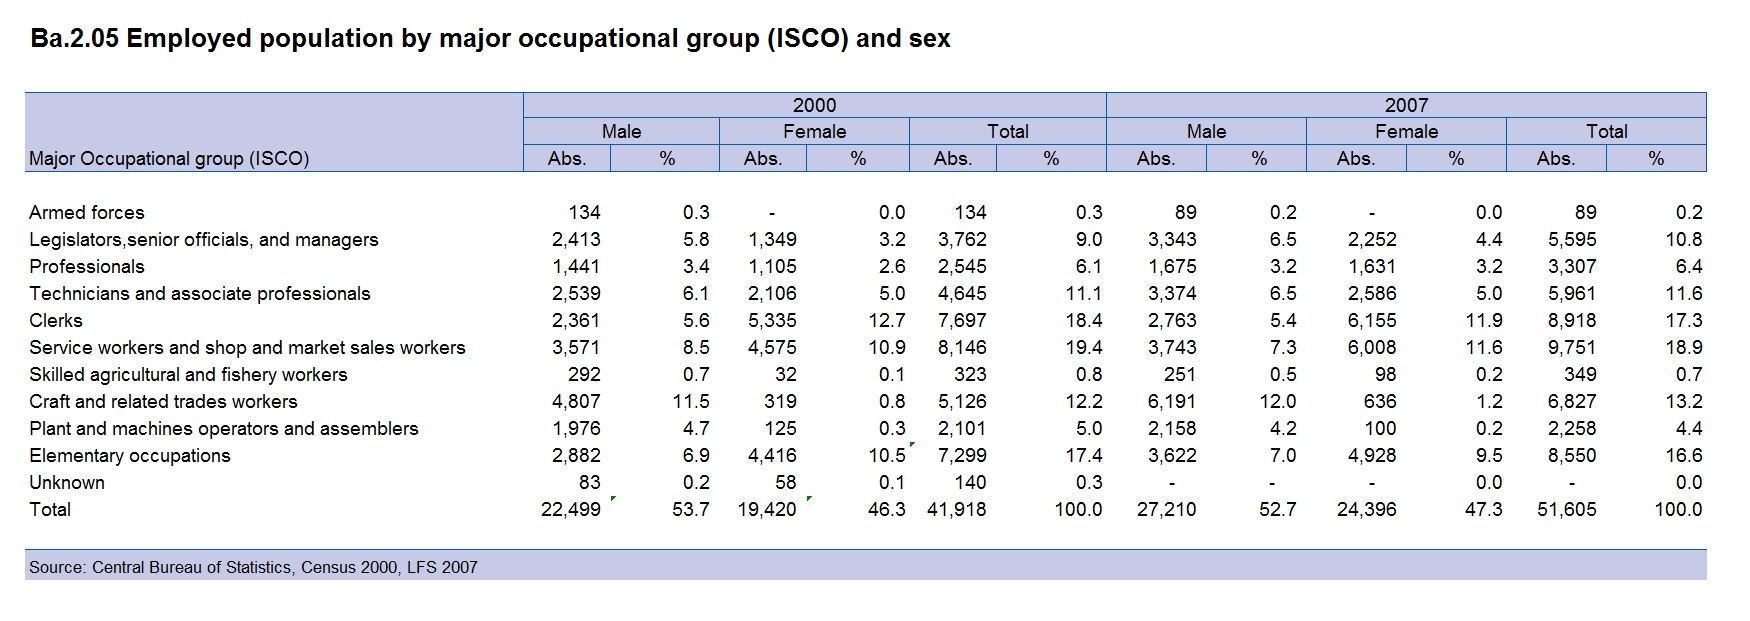
This table shows: Employed population by major occupational group (ISCO) and sex Ba.2.05 Download items: Ba.2.05 – – (35 kB)Continue Reading
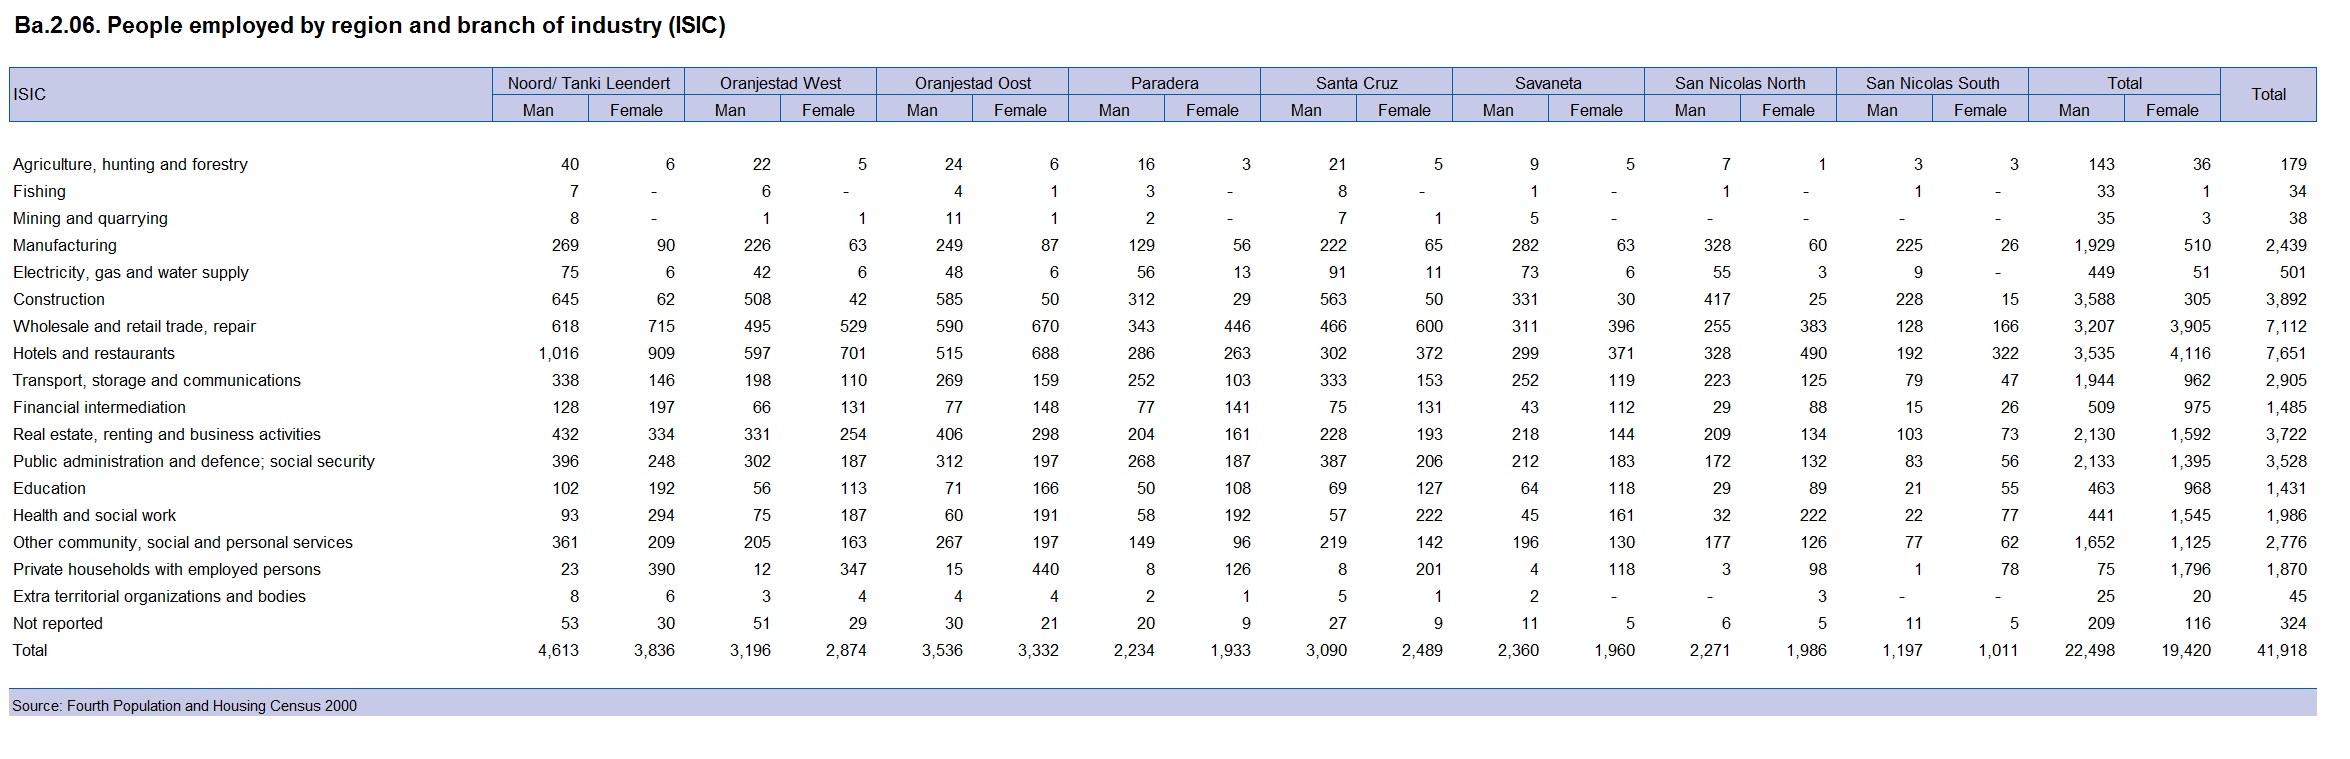
This table shows: People employed by region and branch of industry (ISIC) Ba.2.06 Download items: Ba.2.06 – – (30 kB)Continue Reading
This table shows: Filled jobs by status in employment, sex and institutional sector Ba.2.07 Download items: Ba.2.07 – – (29 kB)Continue Reading
This table shows: People by region of work, age category and sex Ba.2.08 Download items: Ba.2.08 – – (42 kB)Continue Reading