Skip to content

News

News    /

Topbar left

Contact us    /
About us

Right Corner header

Phone: +(297) 524-7433
Central Bureau of Statistics
Better data. Better policies. Better lives. Better Aruba.

All publications by category

Primary Navigation Menu
Menu
  • Home
  • Society
    • Environment Statistics
    • Housing & Demographics
    • Social Statistics
      • Population
      • ICT
      • Health & Welfare
      • Education
      • Migration
      • Justice & Security
      • Traffic, Transport & Communication
      • Government & Politics
      • Quality of Life
      • Labor & Income
        • Income, spending and wealth
        • Labour market
        • Social security
  • Economy
    • Indices
      • Inflation & Prices
        • Press release CPI
          • Press releases CPI – Papiamento
          • Press releases CPI – English
        • CPI Tables
        • Key indicators CPI
        • CPI Reports
        • Inflation Calculator
    • Economic statistics
      • GDP
      • Annual Estimates
      • Quarterly Estimates
      • GDP Data series
      • National Accounts Reports
      • Business & Trade
        • Foreign Trade Statistics
          (Import & Export)
          • Press releases FTS
            • Press releases FTS – Papiamento
            • Press releases FTS – English
          • Tables FTS
          • Reports FTS
          • Key Indicators FTS
          • Visualization FTS
          • Month in review FTS
    • Tourism statistics
      • Tourism in Aruba
      • Visitors Profile
        • Characteristics of the visitors
        • Behavior of the visitors
        • Characteristics of the visitors from the U.S.A
        • Satisfaction of the visitors
      • Money aspects of the visitors
      • Accommodation Statistics
      • Cruise
      • Tourism reports
  • Dashboards
    • Data Dashboard Population
    • Data Dashboard Youth
    • Data Dashboard Economic indicators
  • Statistical overview of Aruba
    • Statistical overview
    • Infographics
    • Visualizations
    • Statistical Yearbook
      (discontinued 2016)
    • Statistical Orientation
      (discontinued 2016)
  • Censuses
  • Presentations & Missions
    • Review Mission Reports
    • Presentations

Labour market (Page 2)

Unemployed persons by duration of unemployment by sex

2009-07-28
On: July 28, 2009
In: Labour market

Continue Reading

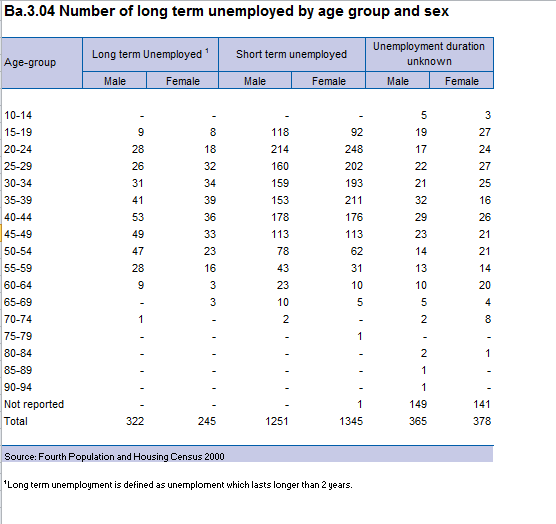
Number of long term unemployed by age group and sex

2009-07-28
On: July 28, 2009
In: Labour market

This table shows the number of long-term unemployed by age group and sex Ba.3.04 Download items: Ba.3.04 – – (20 kB)Continue Reading

Long-term unemployed by country of birth

2009-07-28
On: July 28, 2009
In: Labour market

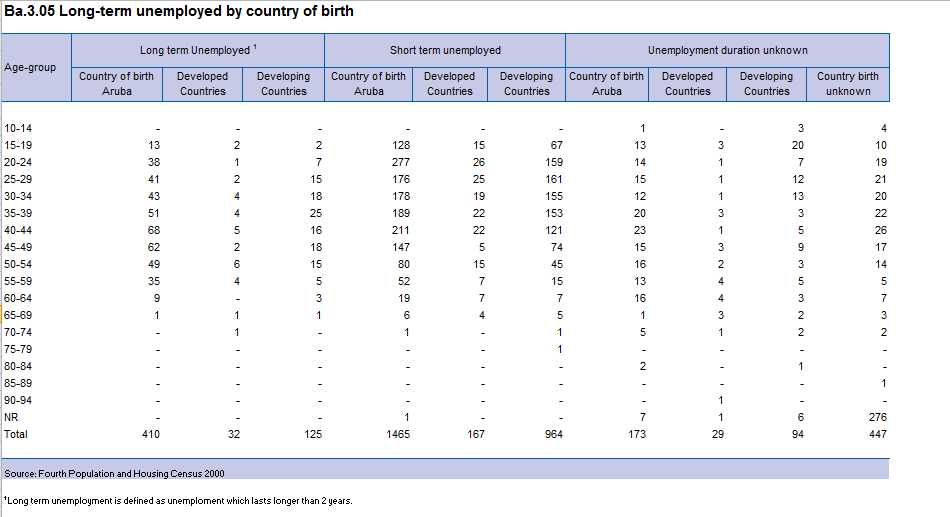
This table shows the long-term unemployment by country of birth Ba.3.05 Download items: Ba.3.05 – – (21 kB)Continue Reading

Long-term unemployed by country of birth and educational attainment

2009-07-28
On: July 28, 2009
In: Labour market

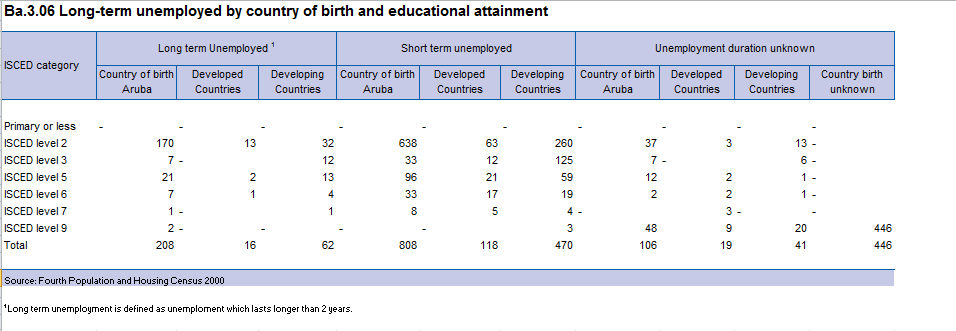
This table shows the long-term unemployment by country of birth and educational attainment Ba.3.06 Download items: Ba.3.06 – – (26 kB)Continue Reading

Ratio of youth unemployed and total unemployment rates

2009-07-28
On: July 28, 2009
In: Labour market

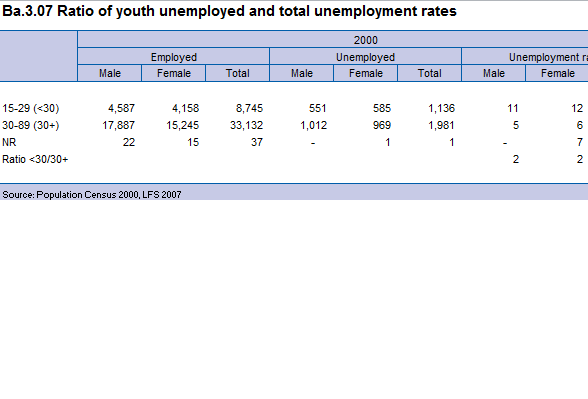
This table shows the ratio of youth unemployed and total unemployment rates Ba.3.07 Download items: Ba.3.07 – – (40 kB)Continue Reading

Proportion youth unemployed to total youth population by age and sex

2009-07-28
On: July 28, 2009
In: Labour market

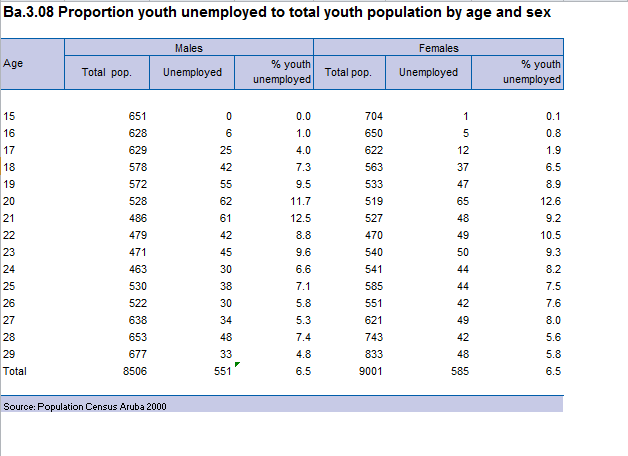
This table shows the proportion of youth unemployment to total youth population by age and sex Ba.3.08 Download items: Ba.3.08 – – (20 kB)Continue Reading

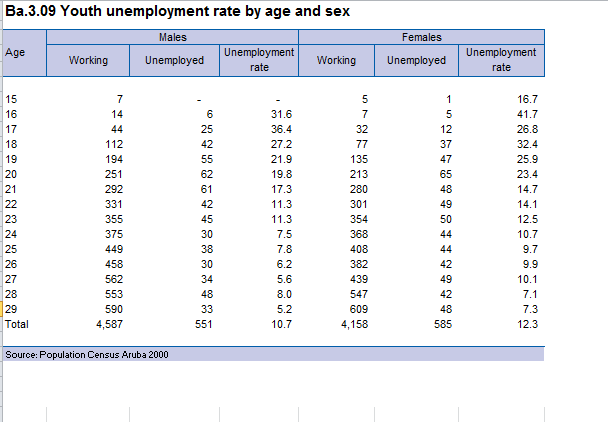
Youth unemployment rate by age and sex

2009-07-28
On: July 28, 2009
In: Labour market

This table shows the youth unemployment rate by age and sex Ba.3.09 Download items: Ba.3.09 – – (20 kB)Continue Reading

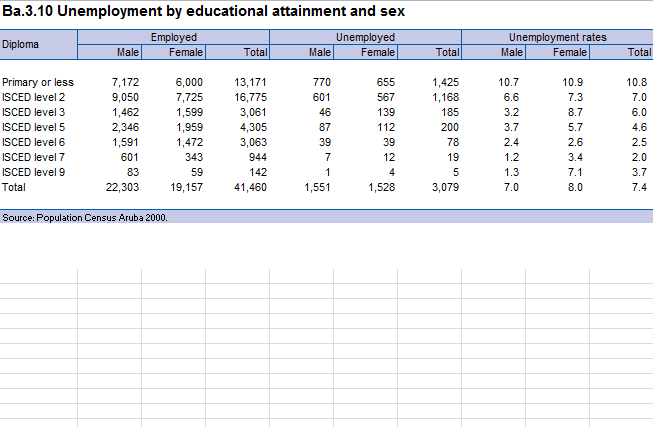
Unemployment by educational attainment and sex

2009-07-28
On: July 28, 2009
In: Labour market

This table shows the unemployment by educational attainment and sex Ba.3.10 Download items: Ba.3.10 – – (25 kB)Continue Reading

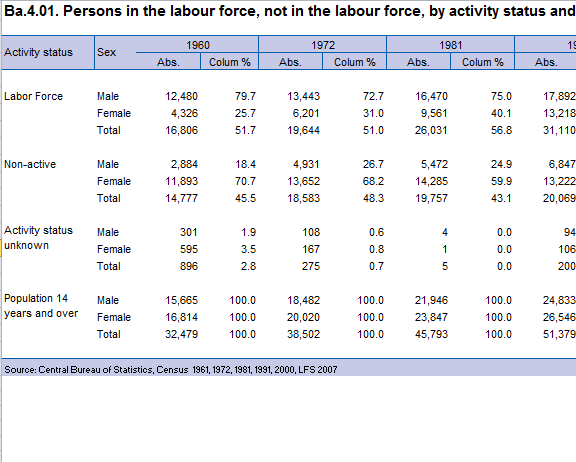
Persons in the labour force, not in the labour force, by activity status and sex

2009-07-28
On: July 28, 2009
In: Labour market

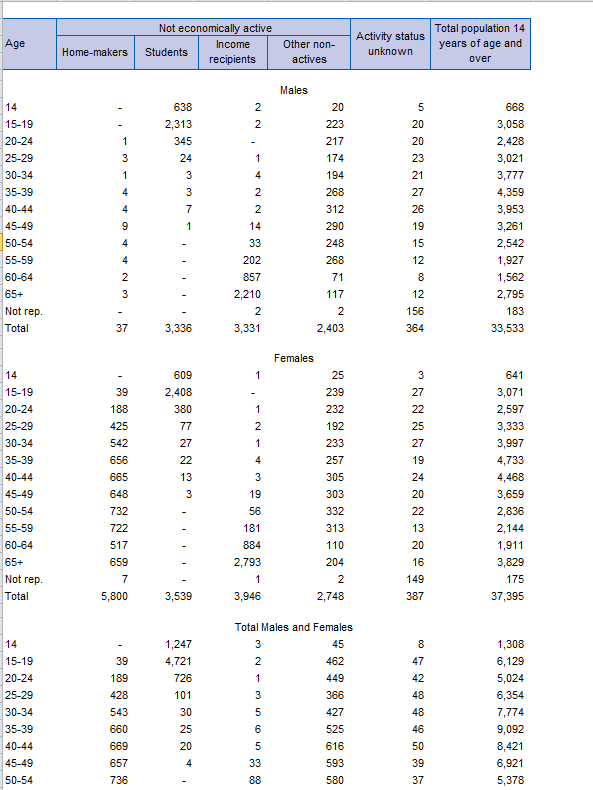
This tables shows the persons in the labor force, not in the labor force, by activity status and sex Ba.4.01 Download items: Ba.4.01 – – (20 kB)Continue Reading

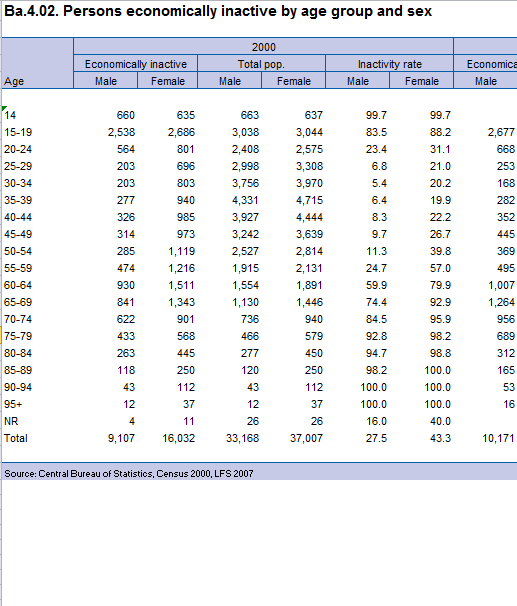
Persons economically inactive by age group and sex

2009-07-28
On: July 28, 2009
In: Labour market

This table shows the persons economically inactive by age group and sex Ba.4.02 Download items: Ba.4.02 – – (29 kB)Continue Reading

People not in the labor force by main activity, age and sex

2009-07-28
On: July 28, 2009
In: Labour market

This table shows the people that are not in the labor force by main activity, age and sex Ba.4.03 Download items: Ba.4.03 – – (27 kB)Continue Reading

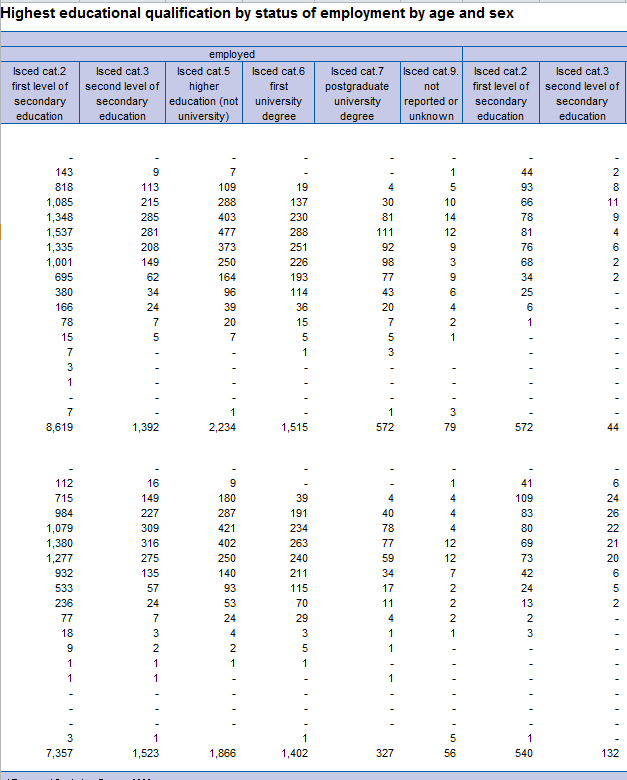
Highest educational qualification by status of employment by age and sex

2009-07-28
On: July 28, 2009
In: Labour market

This table shows the highest educational qualification by status of employment by age and sex Ba.5.01 Download items: Ba.5.01 – – (39 kB)Continue Reading

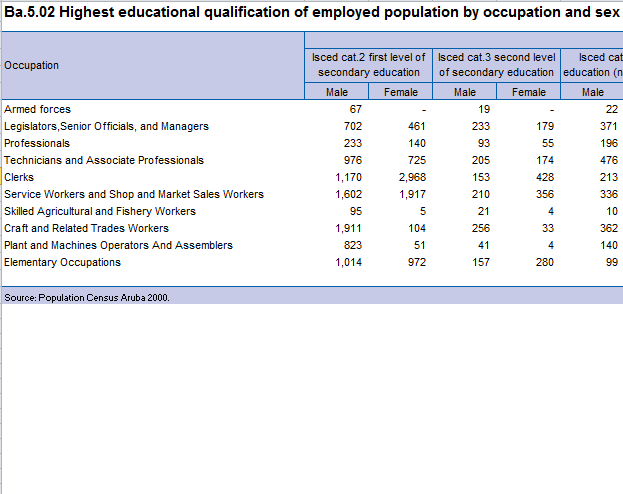
Highest educational qualification of employed population by occupation and sex

2009-07-28
On: July 28, 2009
In: Labour market

This table shows the highest educational qualification of employed population by occupation and sex Ba.5.02 Download items: Ba.5.02 – – (26 kB)Continue Reading

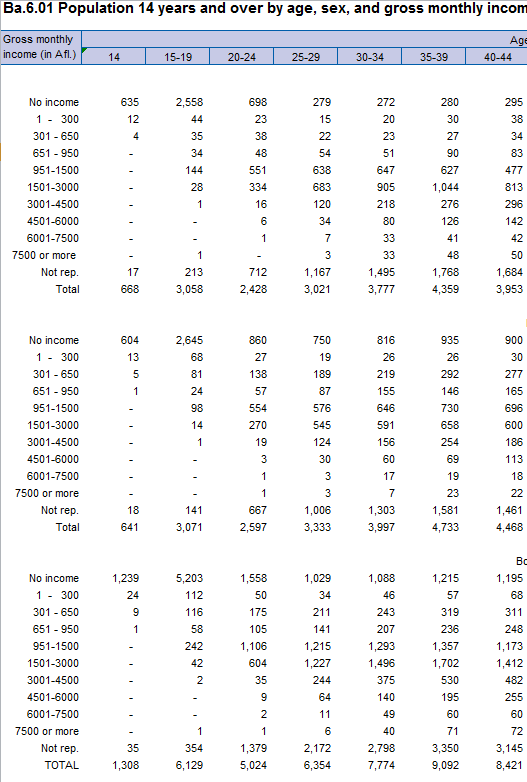
Population 14 years and over by age, sex, and gross monthly income.

2009-07-28
On: July 28, 2009
In: Labour market

This table shows the population of 14 years and over by age, sex and gross monthly income Ba.6.01 Download items: Ba.6.01 – – (32 kB)Continue Reading

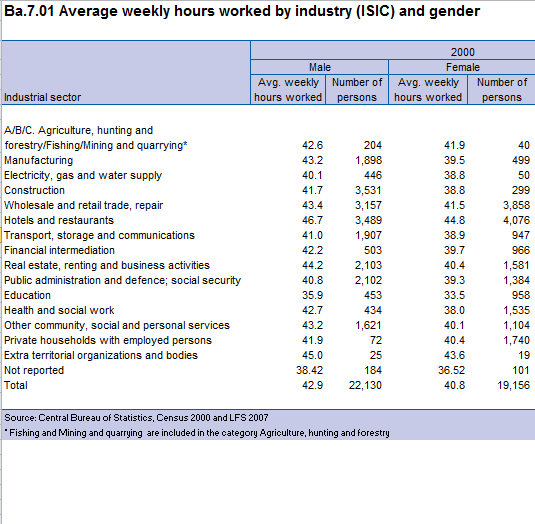
Average weekly hours worked by industry (ISIC) and gender

2009-07-28
On: July 28, 2009
In: Labour market

This table shows the average weekly hours worked by industry (according to ISIC) and gender Ba.7.01   Download items: Ba.7.01 – – (34 kB)Continue Reading

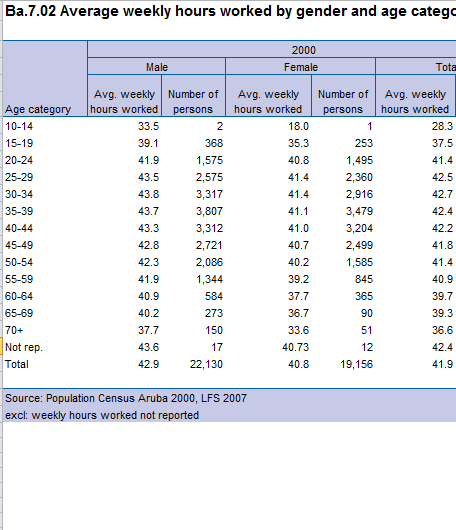
Average weekly hours worked by gender and age category

2009-07-28
On: July 28, 2009
In: Labour market

This table shows the average of weekly hours worked by gender and age category Ba.7.02 Download items: Ba.7.02 – – (36 kB)Continue Reading

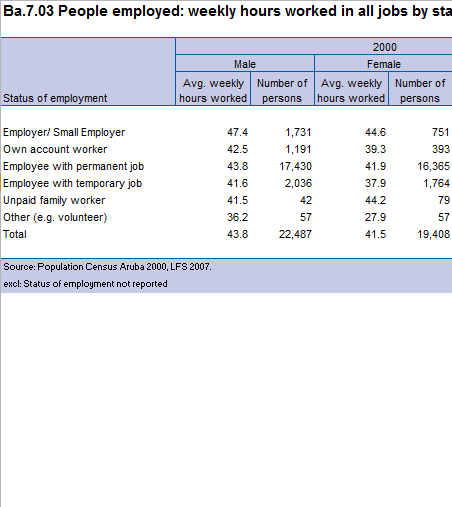
People employed: weekly hours worked in all jobs by status of employment

2009-07-28
On: July 28, 2009
In: Labour market

In this table you will find information about people employed based on weekly hours working in all jobs by their status Ba.7.03 Download items: Ba.7.03 – – (32 kB)Continue Reading

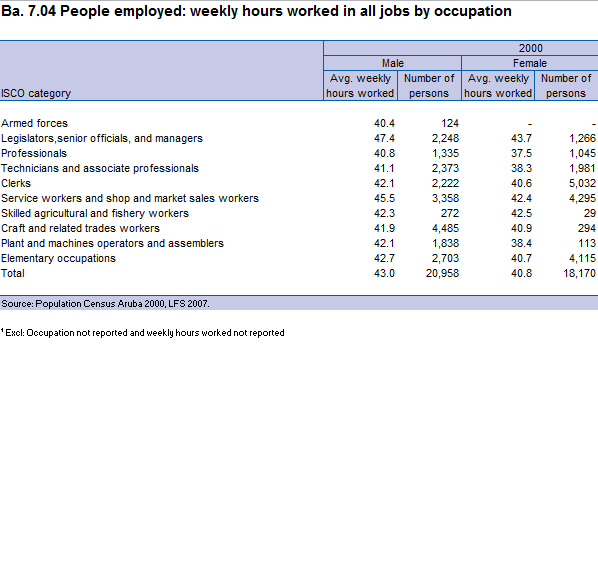
People employed: weekly hours worked in all jobs by occupation

2009-07-28
On: July 28, 2009
In: Labour market

In this table you can find information about the people employed on basis of weekly hours working in all jobs Ba.7.04     Download items: Ba.7.04 – – (36 kB)Continue Reading

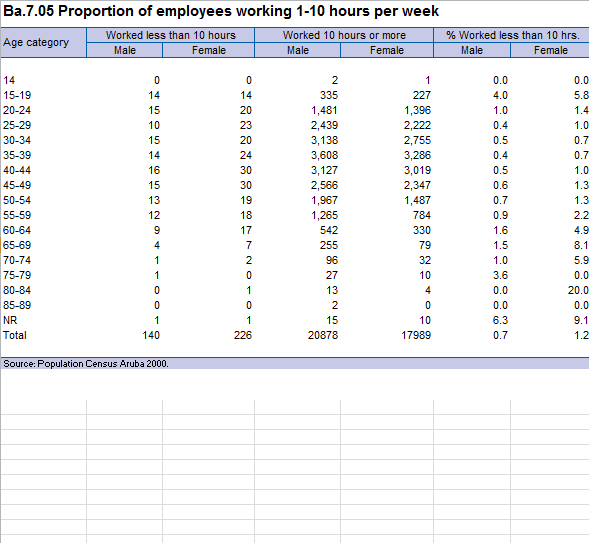
Proportion of employees working 1-10 hours per week

2009-07-28
On: July 28, 2009
In: Labour market

In this table you can find information about the proportion of employees working 1 – 10 hours per week Ba.7.05 Download items: Ba.7.05 – – (27 kB)Continue Reading

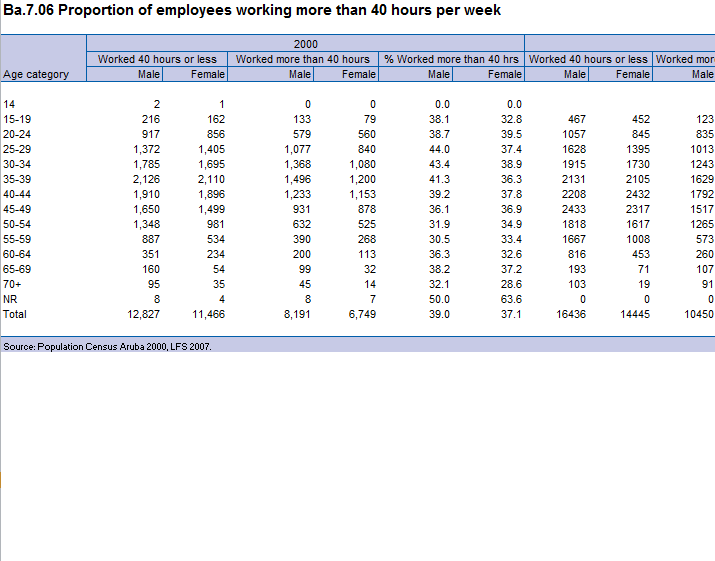
Proportion of employees working more than 40 hours per week

2009-07-28
On: July 28, 2009
In: Labour market

In this table you can find information about the proportion of employees working more than 40 hours per week Ba.7.06 Download items: Ba.7.06 – – (37 kB)Continue Reading

Posts navigation

Previous 1 2 3 Next

In this category

  • Results Labor Force Survey 2021 June 2, 2022
  • Labour force Dutch Caribbean islands July 25, 2019
  • Employed population by branch of industry (ISIC major division) and sex May 25, 2018
  • People employed by region and branch of industry (ISIC) May 25, 2018
  • Employed population by major occupational group (ISCO) and sex May 25, 2018
  • People Employed, Unemployed and Not in the Labor Force by educational attainment and sex May 25, 2018
  • People Employed, Unemployed and not in the Labor Force by marital status and sex May 25, 2018
  • People Employed, Unemployed and not in the Labor Force, by region of residence May 25, 2018
  • People unemployed, unemployment rates by age group and sex November 12, 2015
  • People employed by type of country of birth by age group November 12, 2015
  • People employed by full-time and part-time status by age and sex November 12, 2015
  • People employed by status in employment and sex November 12, 2015
  • Labor Force Participation Rates, by age group and sex November 12, 2015
  • People Employed, Unemployed and not in the Labor Force, by age group November 12, 2015
  • People Employed, Unemployed and not in the Labor Force, by sex November 12, 2015
  • Filled jobs by status in employment, sex and institutional sector November 12, 2015
  • People by region of work, age category and sex November 12, 2015
  • Number of persons by place of work and mode of transport to work November 12, 2015
  • Employed population by industry (ISIC), local and foreign born and gender November 12, 2015
  • People unemployed and unemployment rates by country of birth and sex November 12, 2015
  • Unemployed persons by duration of unemployment by sex November 12, 2015
  • Number of long term unemployed by age group and sex November 5, 2015
  • Long-term unemployed by country of birth November 5, 2015
  • Long-term unemployed by country of birth and educational attainment November 5, 2015
  • Ratio of youth unemployed and total unemployment rates November 5, 2015
  • Proportion youth unemployed to total youth population by age and sex November 5, 2015
  • Youth unemployment rate by age and sex November 5, 2015
  • Unemployment by educational attainment and sex November 5, 2015
  • Persons in the labour force, not in the labour force, by activity status and sex November 5, 2015
  • Persons economically inactive by age group and sex November 5, 2015
  • People not in the labor force by main activity, age and sex November 5, 2015
  • Highest educational qualification by status of employment by age and sex November 4, 2015
  • Highest educational qualification of employed population by occupation and sex November 4, 2015
  • Population 14 years and over by age, sex, and gross monthly income. November 4, 2015
  • Average weekly hours worked by industry (ISIC) and gender November 4, 2015
  • Average weekly hours worked by gender and age category November 4, 2015
  • People employed: weekly hours worked in all jobs by status of employment November 4, 2015
  • People employed: weekly hours worked in all jobs by occupation November 4, 2015
  • Proportion of employees working 1-10 hours per week November 4, 2015
  • Proportion of employees working more than 40 hours per week November 4, 2015
  • Labor Force Survey 1997 October 27, 2015
  • Currrent Developments of Aruba’s labor market 2003 September 29, 2015

Central Bureau of Statistics Aruba

Sun Plaza Building

LG Smith Boulevard 160, 3rd Floor

Office Hours:

Monday-Friday 7:30am – 4:30pm

Phone: +(297) 524-7433

General information

  • All posts
  • Login CBS
  • Contact us
  • About us
  • Request data
  • Census
  • FAQ (Frequently Asked Questions)
  • Links
  • Feedback form

Methods

  • Standards
  • Classifications
  • Statistical Act
  • Terminology