ICT 65+
The population of Aruba, 65 years and older and the world of ICT.Continue Reading
Gender Statistics
Economic structures Education Health and related services Public life & decision making Human rights Economic structures Indicator Custodian agencies Males Females Source of information Labour force participation rate for persons aged 15-24 and 15+, by sex ILO 40.9 36.9 Labor Force Survey, 2017. Directorate of Labor and Research,Continue Reading
Back to school 2019
These are the school locations based on the school type for students of age category between 4 to 16 years old.Continue Reading
Aruba Migration and Integration Study (AMIS)
This publication contains in-dept analysis of the migrants on Aruba. Data source is the Aruba Migration and Integration Study 2016 (AMIS 2016) conducted in 2016 by CBS.Continue Reading
How happy is Aruba?
This is an info-graphics that presents a part of the result for the Social Well-being Survey conducted in 2016.Continue Reading
Hapiness and important life domains
This is an info-graphics that presents a part of the result for the Social Well-being Survey conducted in 2016.Continue Reading
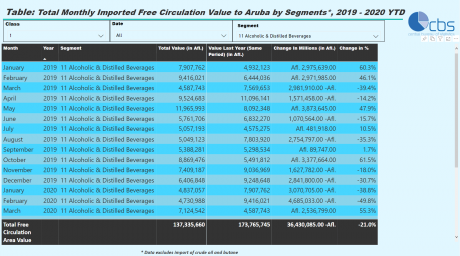
Total Imported Value to Aruba by Alcoholic Beverage Categories (2019)
The following visualization contains information about the total cost, insurance & freight (CIF) value of imported goods of alcoholic beverages in 2019. The ‘Imports to Aruba (Free Circulation Area)’ and the ‘Imports to the Free Zone’ are analyzed by alcoholic beverage categories, sea/air and regions. The Import to the freeContinue Reading
Imported Value of Alcoholic Beverages (2018)
The following info-graphic report contains information about the total cost, insurance & freight (CIF) value of imported goods of alcoholic beverages in 2018. he ‘Imports to Aruba (Free Circulation Area)’ and the ‘Imports to the Free Zone’ are merely analyzed by alcoholic categories, sea/air and regions. The Import to theContinue Reading
Key Figures
Description Period Value Inflation Monthly change Jun-19 0.7% End of period Jun-19 4.8% Period average Jun-19 4.6% GDP of Aruba (preliminary) 2017 Afl.5,471 Mln Airport Commercial Landings Dec YTD 2015 17,546 (+20,93%) Airport Arrivals Foreigners Dec YTD 2014 1,100,334 (+10.7%) Government Tax Revenue Year 2018 1,141.5 Total population 2nd QRTContinue Reading
International Women’s day 2018
For International Women’s day 2018 we compiled a couple of statistics that profiles the women of aruba. Download items: International Women’s Day – – (4 MB)Continue Reading
2014 FIFA World Cup Brazil
Fifa World Cup Brazil 2014 Download items: Fifa World Cup_ENGLISH – – (269 kB)Continue Reading
World Population Day 2014
World Population Day 2014 infographic Download items: WPD2014 – – (550 kB)Continue Reading
Infographic World Literacy Day
Info graphic World Literacy Day Download items: infographic world literacy day2014 – – (293 kB)Continue Reading