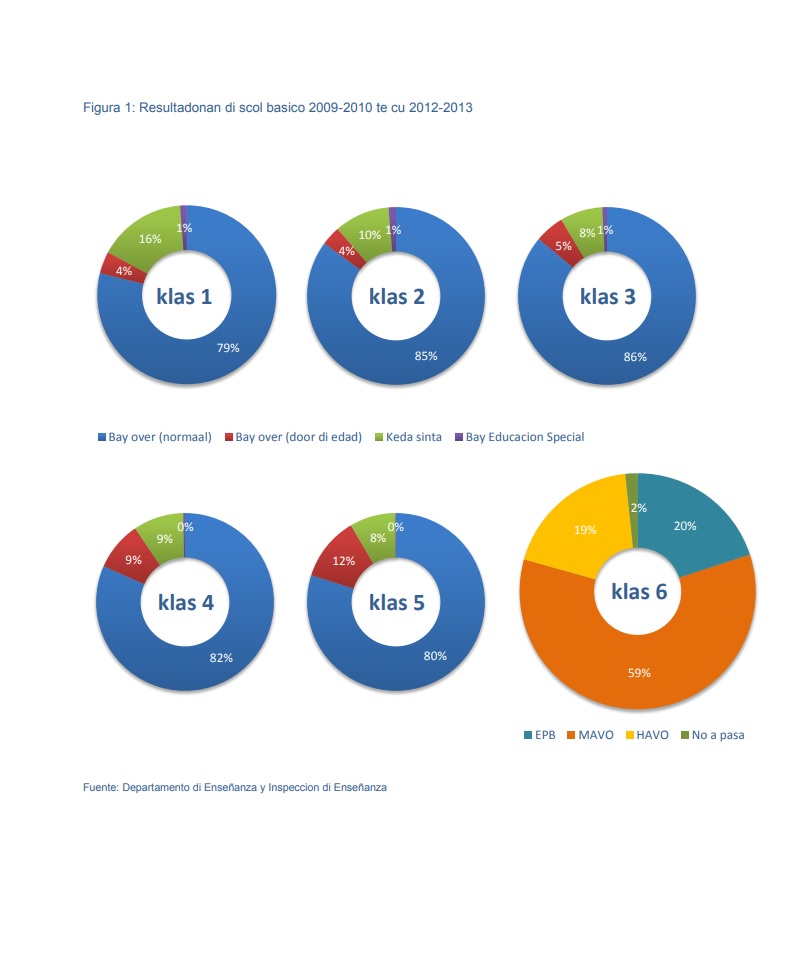
Resultadonan di Scol Basico pa añanan 2009-2010 te cu 2012-2013
2014-07-09
E aña escolar 2013-2014 ta tras di lomba. Pa cada alumno e aña escolar tin un resultado sea positivo of menos positivo. Ban tira un bista riba e resultadonan di enseñanza pa scol basico y e transicion di scol basico pa scol secundario pa e scolnan publico. Download items: krantenartikel_schoolresultatenContinue Reading